Data and Methods
What each map layer shows, which data it uses, and how it was prepared for Zagreb. On the dashboard, the ! button opens a short version of the same notes.
No layers match that search.
Baseline (citywide heat)
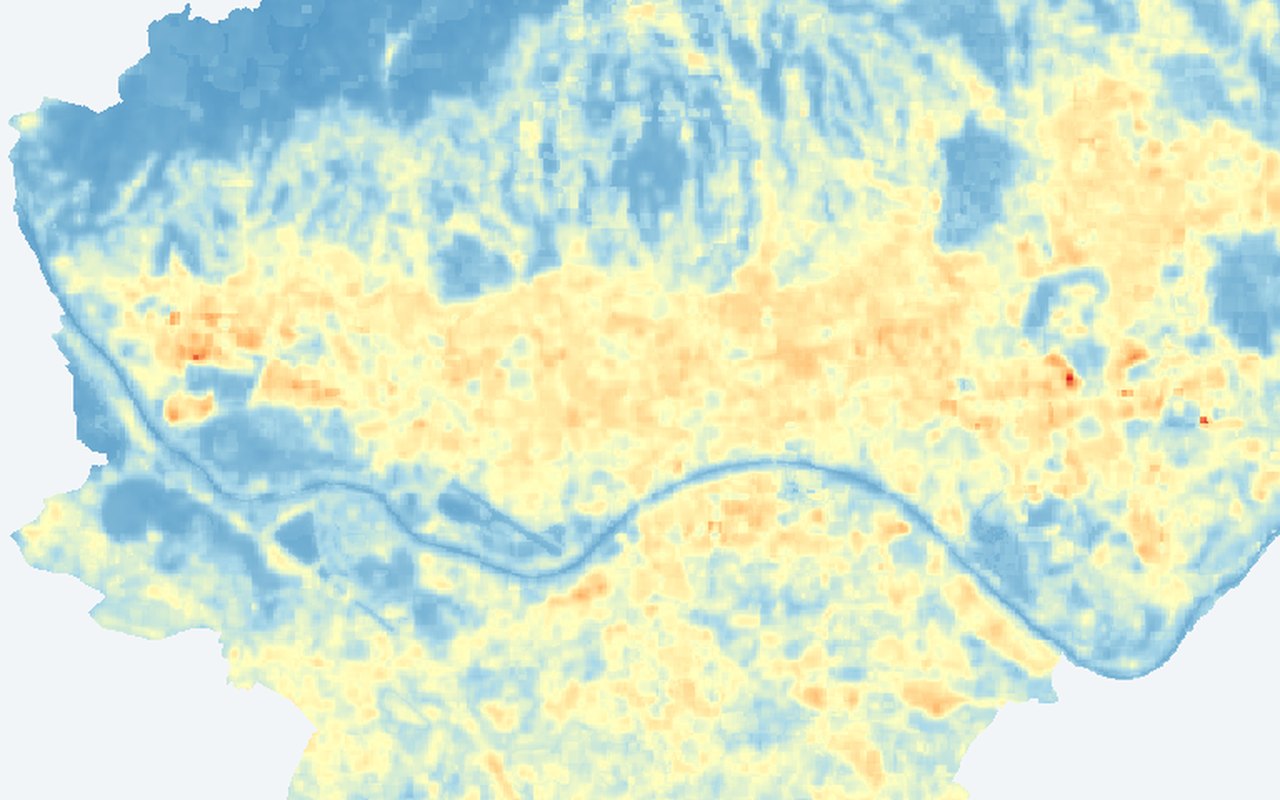
10Land surface temperature
A citywide map of summer land surface temperature — how hot roofs, streets, parks, and other surfaces appear from space. Warmer colours mark hotter surfaces; cooler colours mark greener or more open areas.
ECOSTRESS LST composite (~70 m)
Daytime land surface temperature from NASA ECOSTRESS at roughly 70 m detail — finer than classic Landsat thermal, useful for spotting hot corridors inside the city.
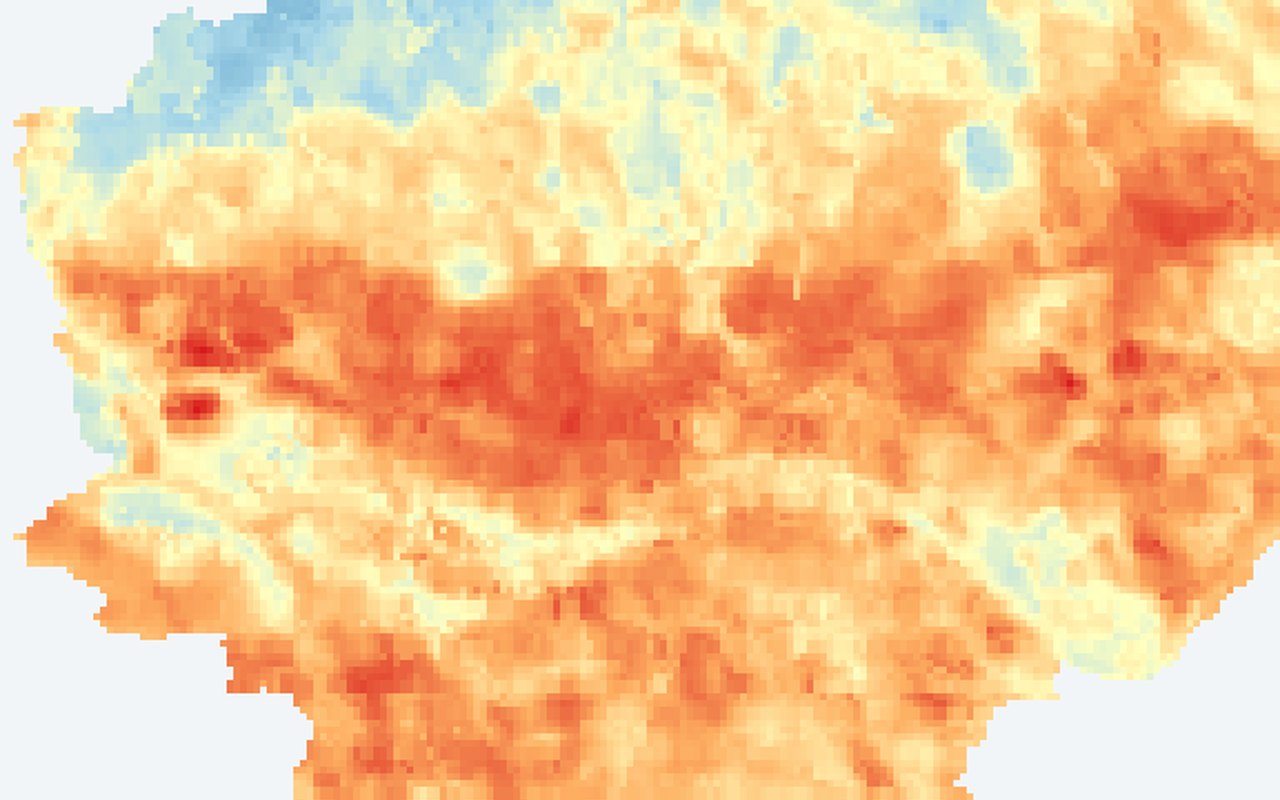
ECOSTRESS night LST composite (~70 m)
Night-time land surface temperature from ECOSTRESS, showing where the city stays warm after sunset.
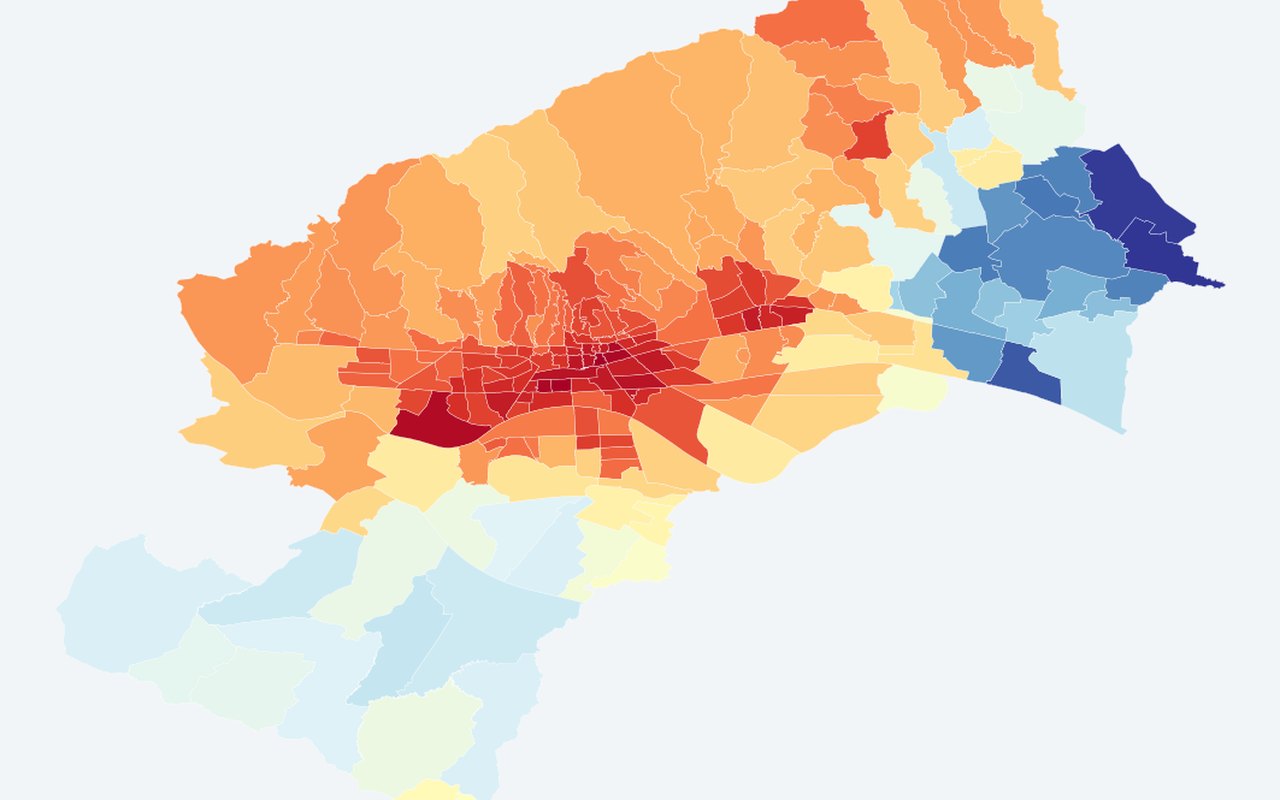
ECOSTRESS night LST — MO (°C)
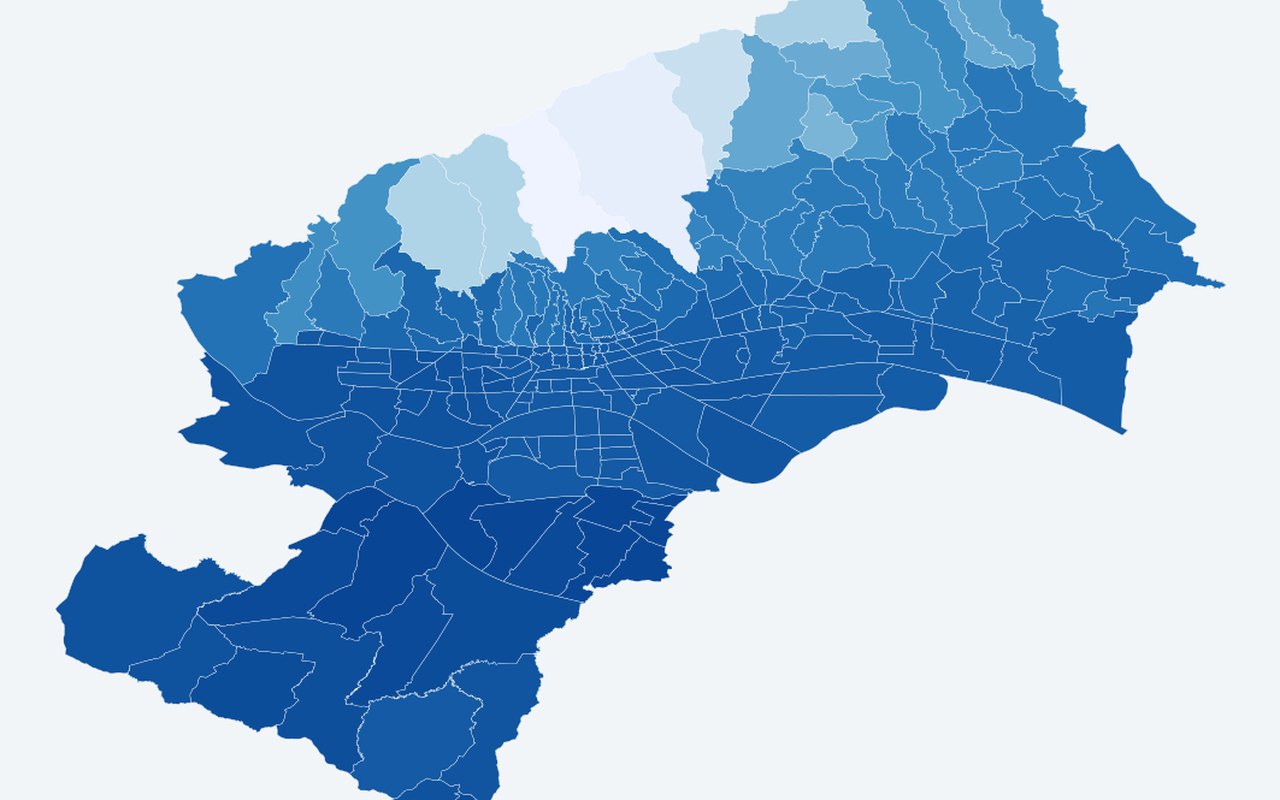
Average night-time land surface temperature for each Zagreb neighbourhood, showing which areas stay warmer after dark.
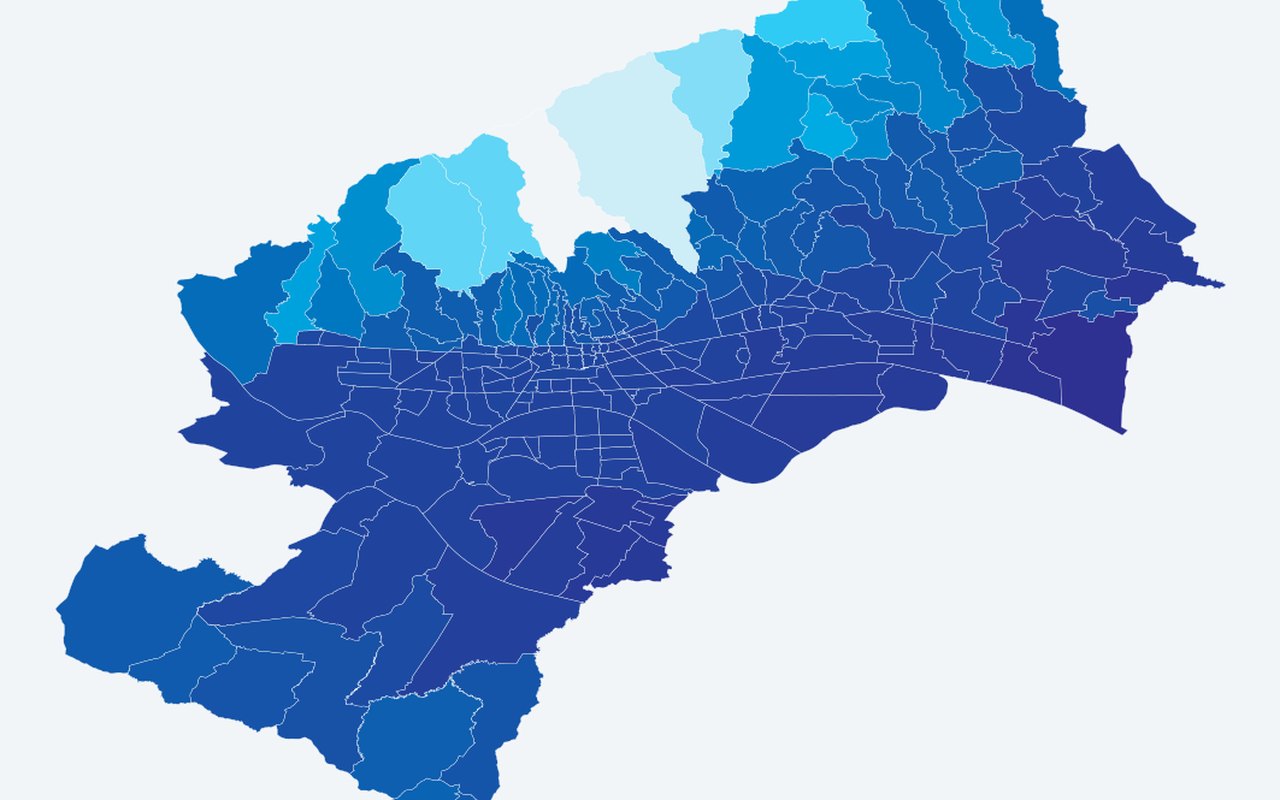
Estimated 2 m air temperature — MO (°C)
neighbourhood choropleth of bias-corrected reanalysis / station-calibrated 2 m air (°C). Station-calibrated modelled air temperature by neighbourhood.
Estimated apparent temperature — MO (°C)
neighbourhood choropleth of estimated apparent temperature (°C). Apparent (feels-like) temperature by neighbourhood from air-temp calibration.
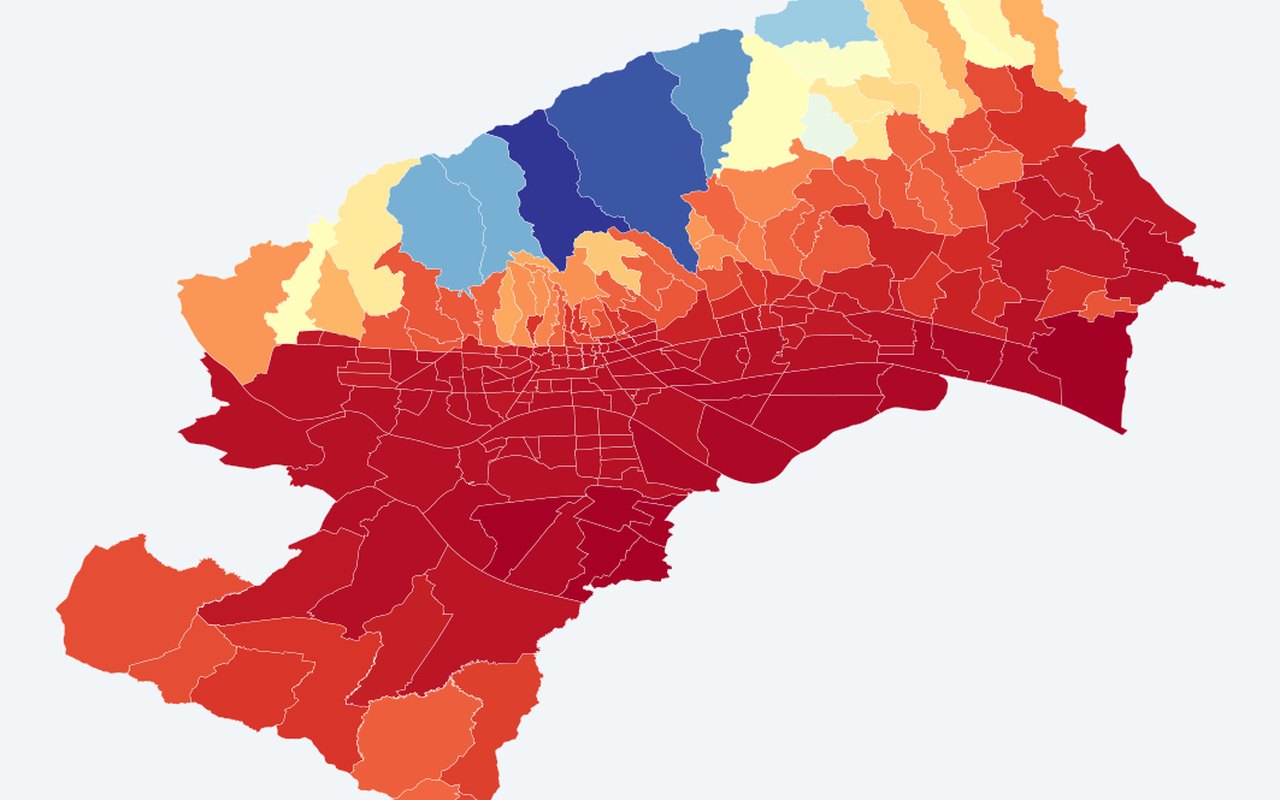
LST — MO polygons (Summer 2024, Atmosphere 2026)
Mean Landsat 8/9 land surface temperature (°C) per neighbourhood from the paper's 2024 acquisition window. Higher = hotter surface.
Near-surface air temperature — MO (Summer 2024, Atmosphere 2026)
Mean 2 m air temperature (°C) at ~11:00 CEST on each 2024 Landsat date, averaged across acquisitions (ERA5-Land via Open-Meteo).
Surface–air coupling zones (Atmosphere 2026)
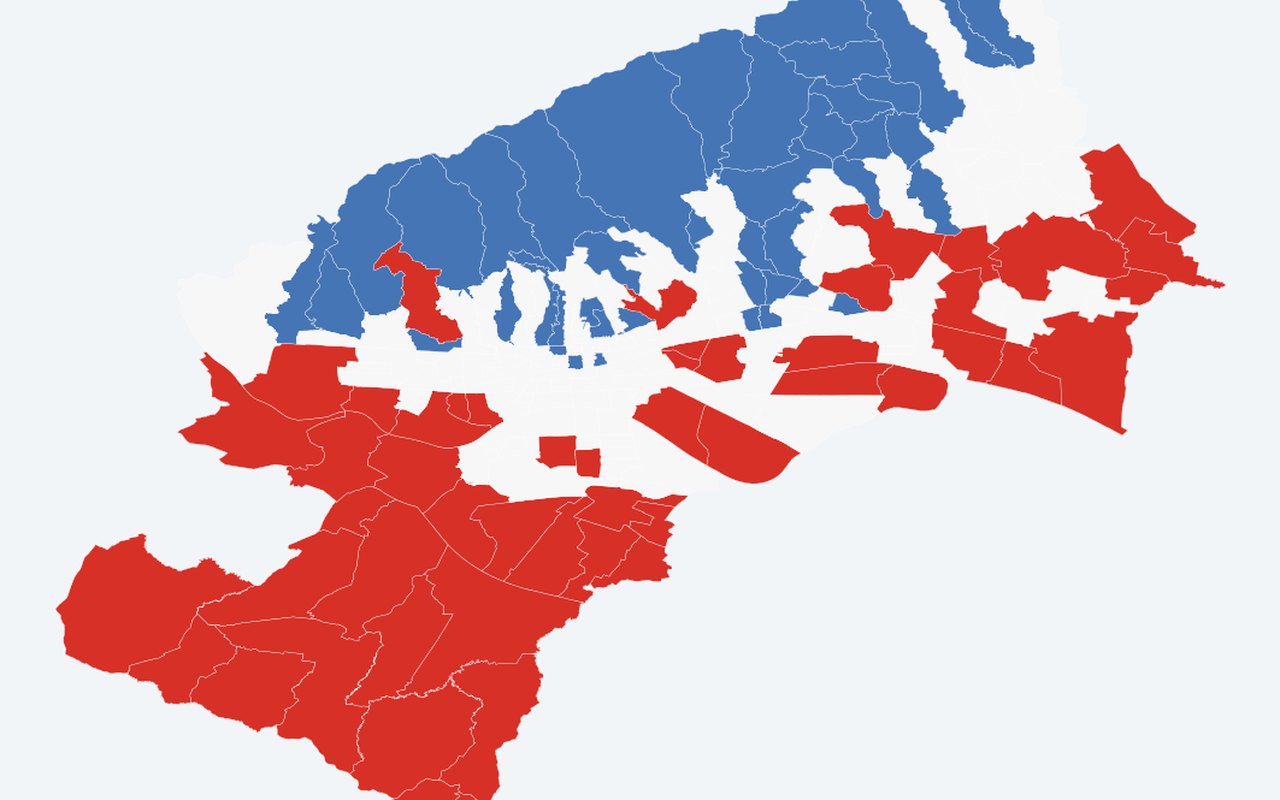
regression air temperature~land surface temperature residuals: coupled (|z|≤0.5 SD), air temperature above expected (warm air vs surface), air temperature below expected (ventilation/cool drainage).
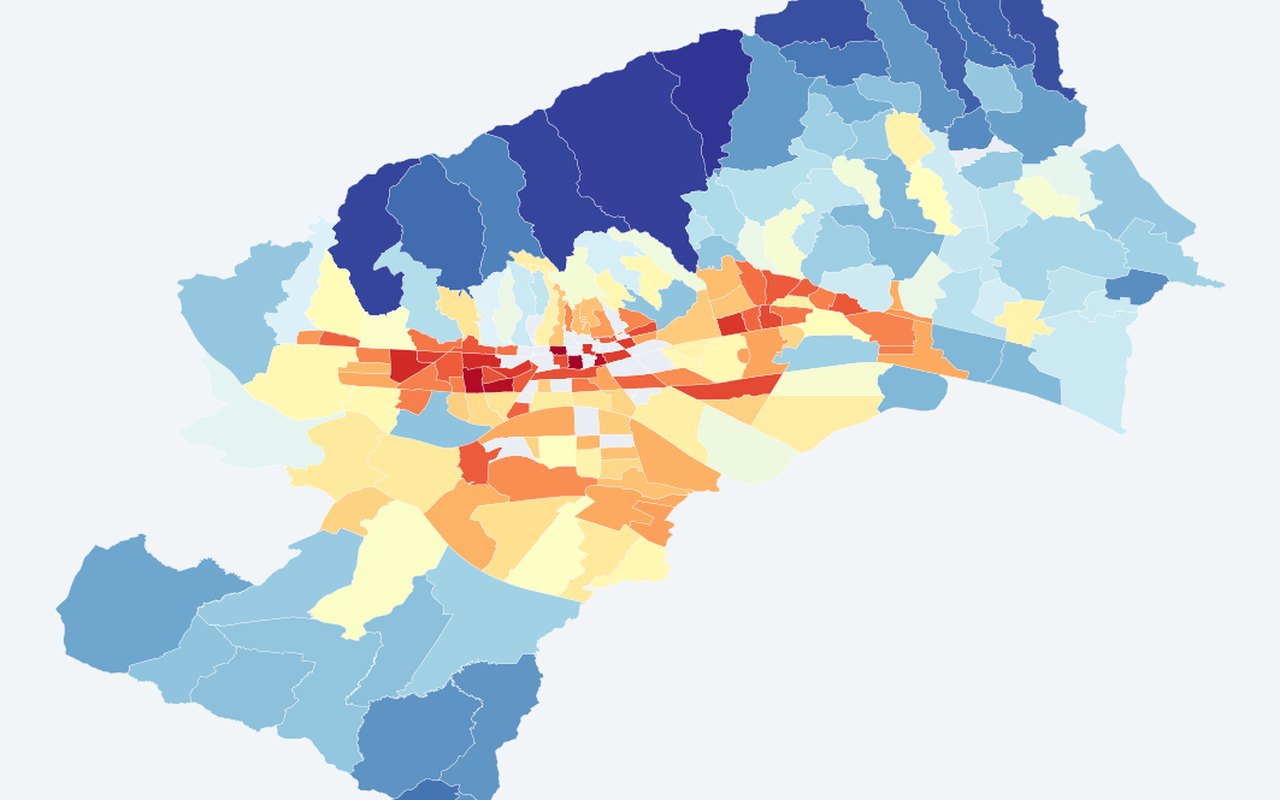
LST vs TAIR hot-spot overlap (Atmosphere 2026)
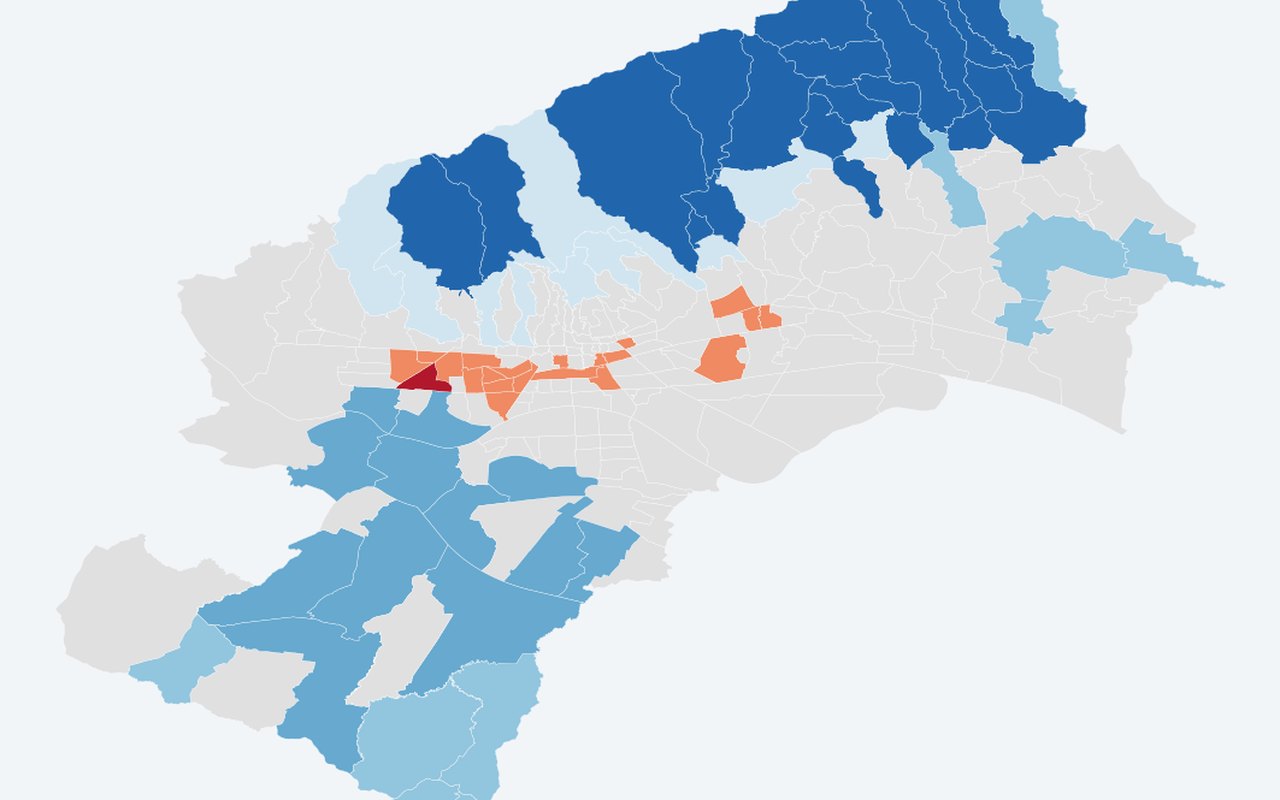
Getis–Ord Gi* cross-tabulation: both hot/cold, land surface temperature-only, air temperature-only, or not significant (α=0.05).
Satellite rasters
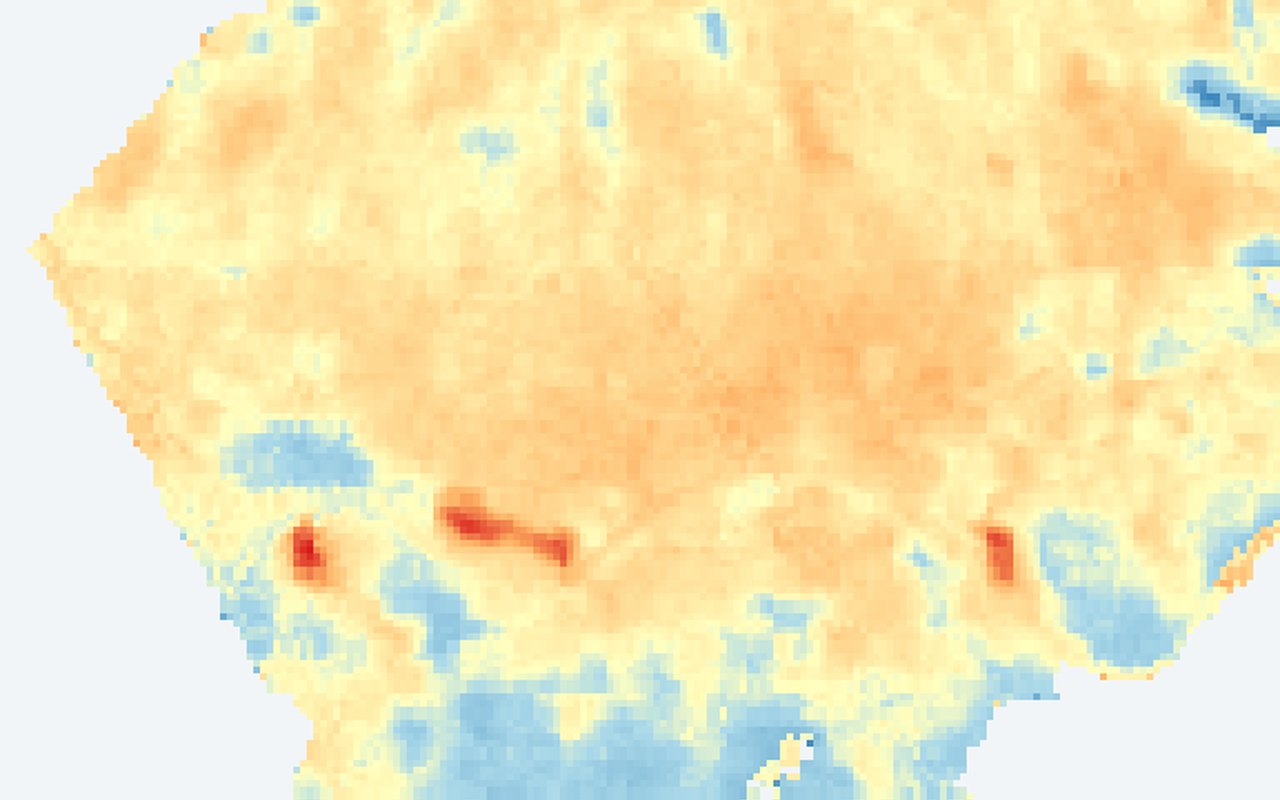
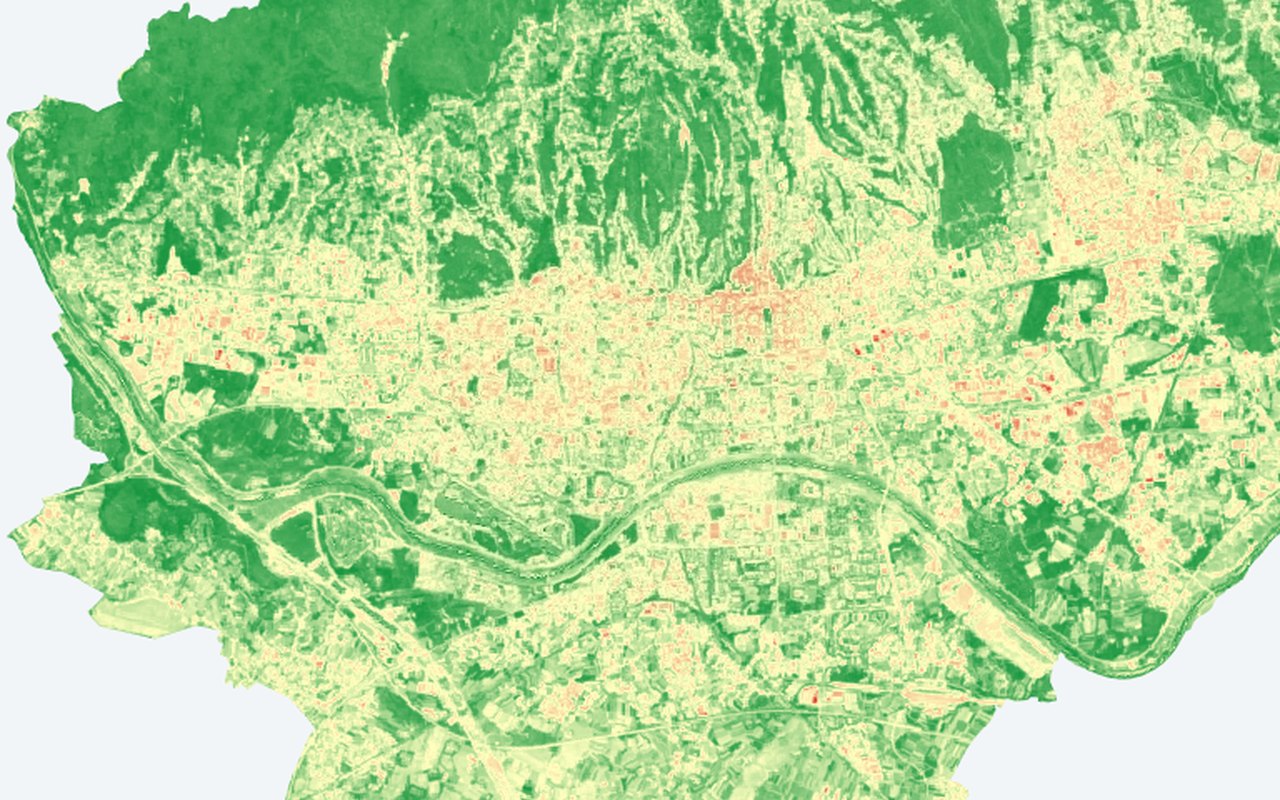
13NDVI (Vegetation)
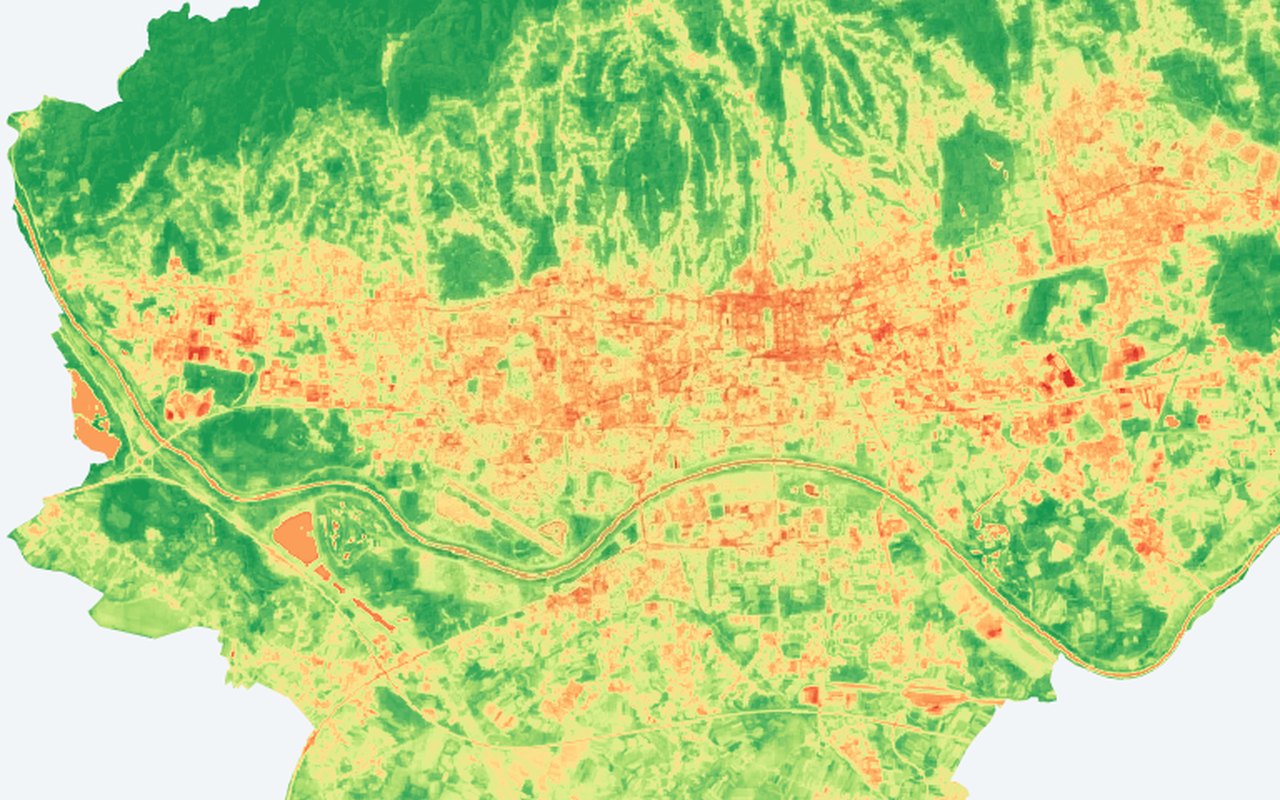
(NIR − Red) / (NIR + Red); higher = greener / more photosynthesis. Landsat vegetation greenness vegetation index tiles.
NDBI (Built-up)
(SWIR − NIR) / (SWIR + NIR); higher = more built / impervious surface. Landsat built-up intensity built-up index tiles.
Elevation
Above-sea-level elevation (m). Elevation / DEM tiles.
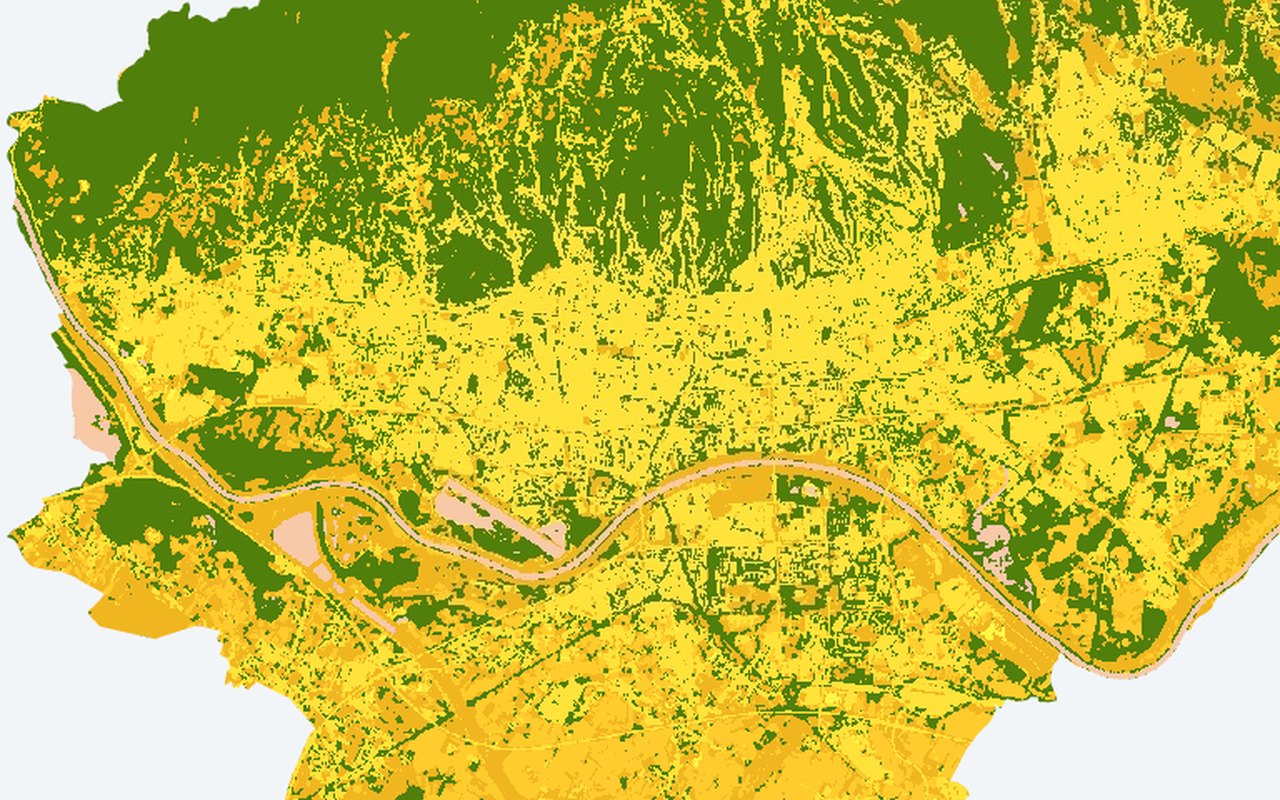
Land Cover
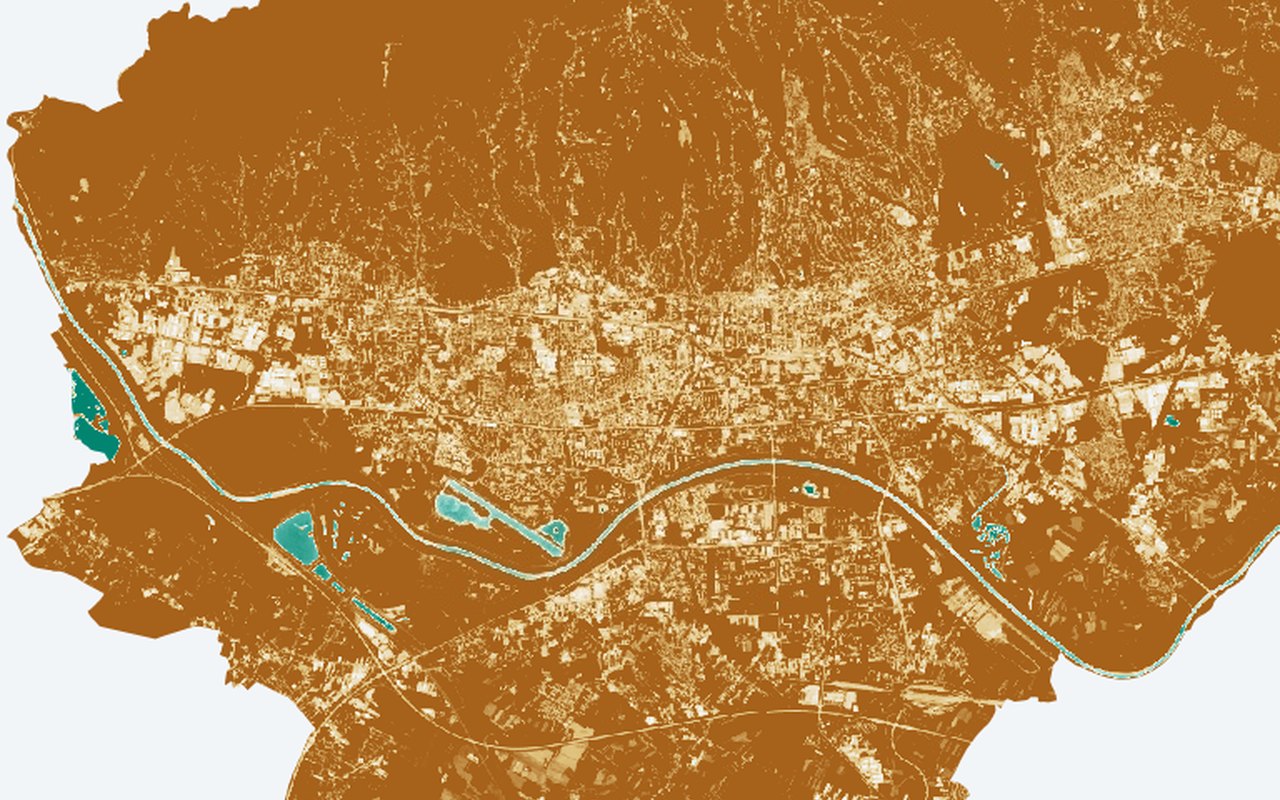
ESA WorldCover 10 m classes (built-up, trees, cropland, water, …). Land-cover classification tiles.
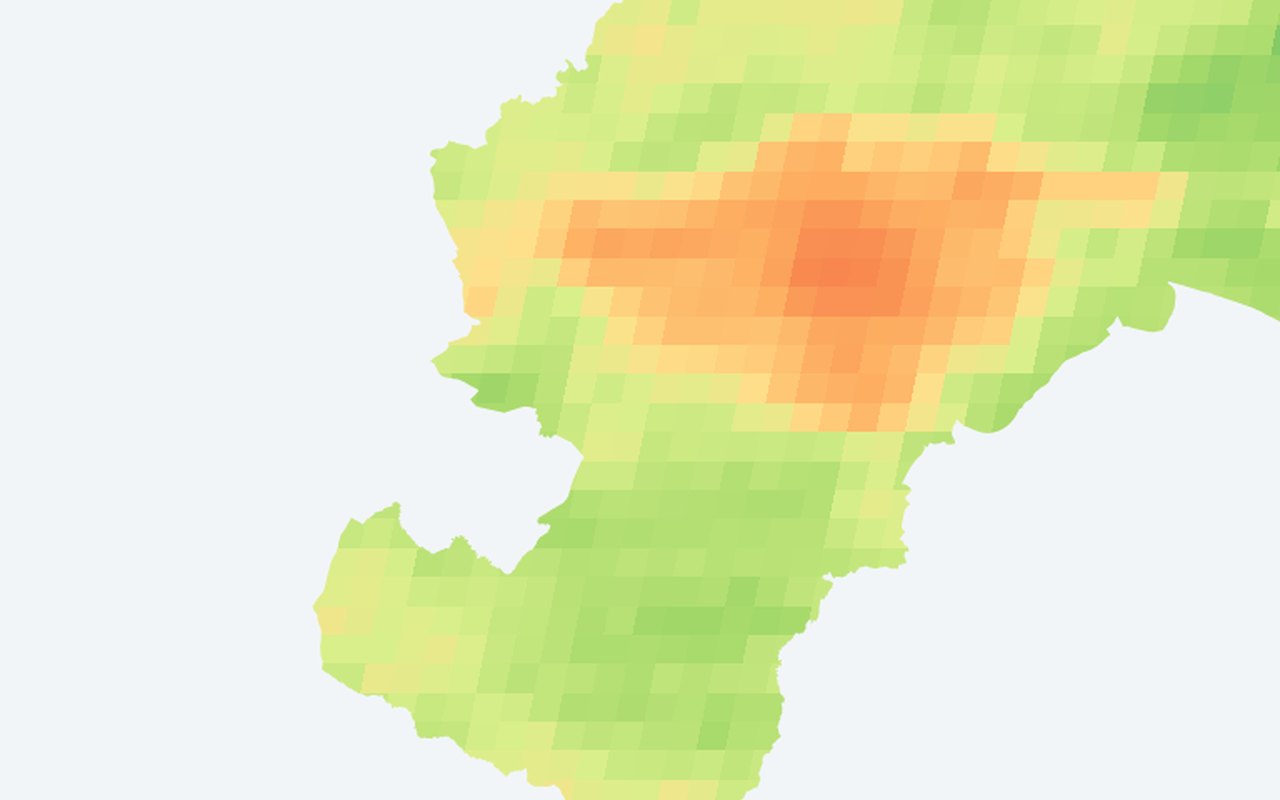
MODIS Nighttime LST (°C)
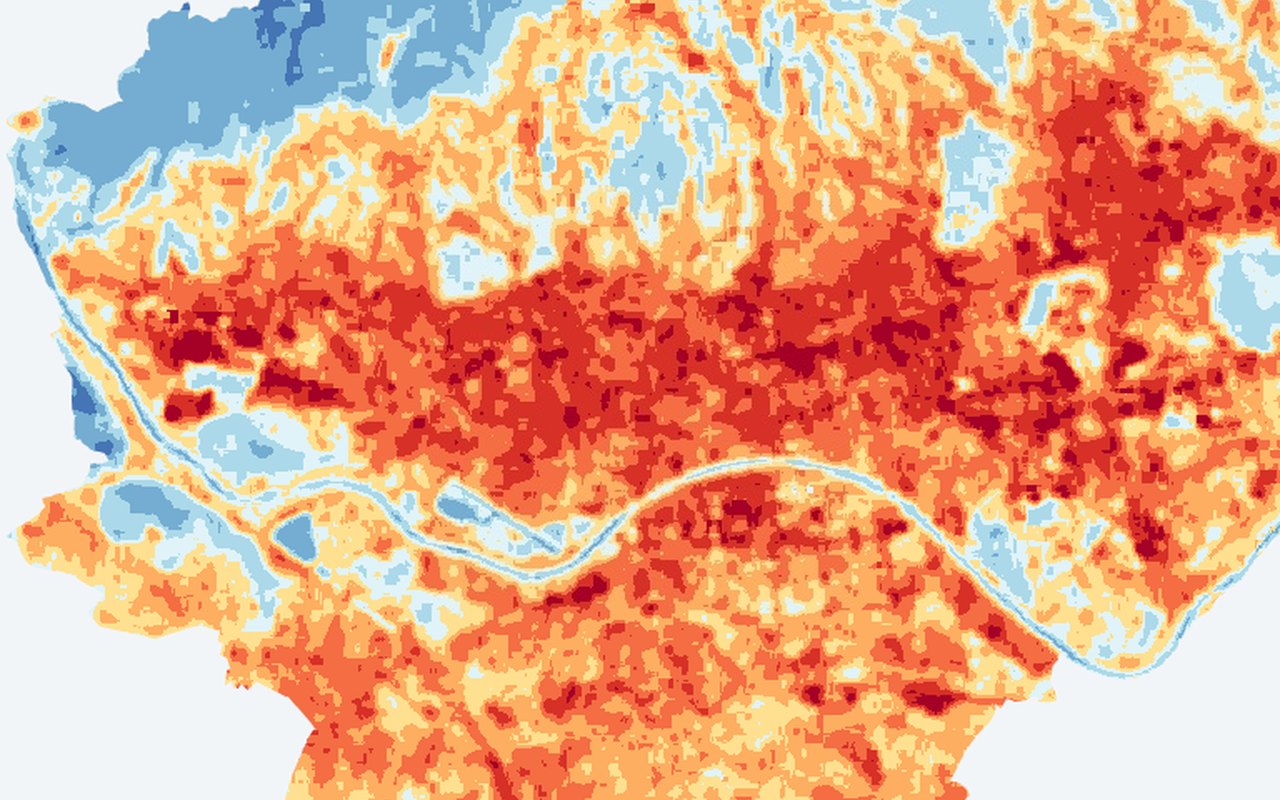
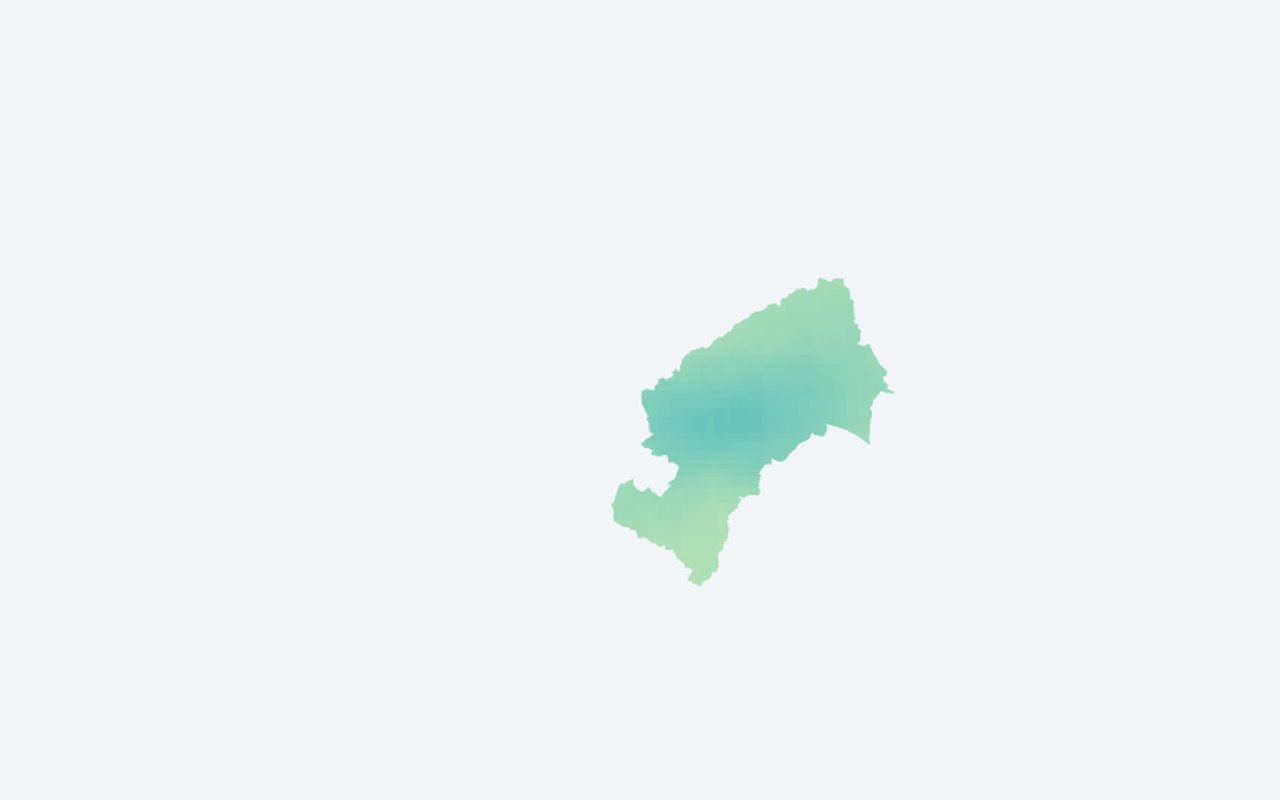
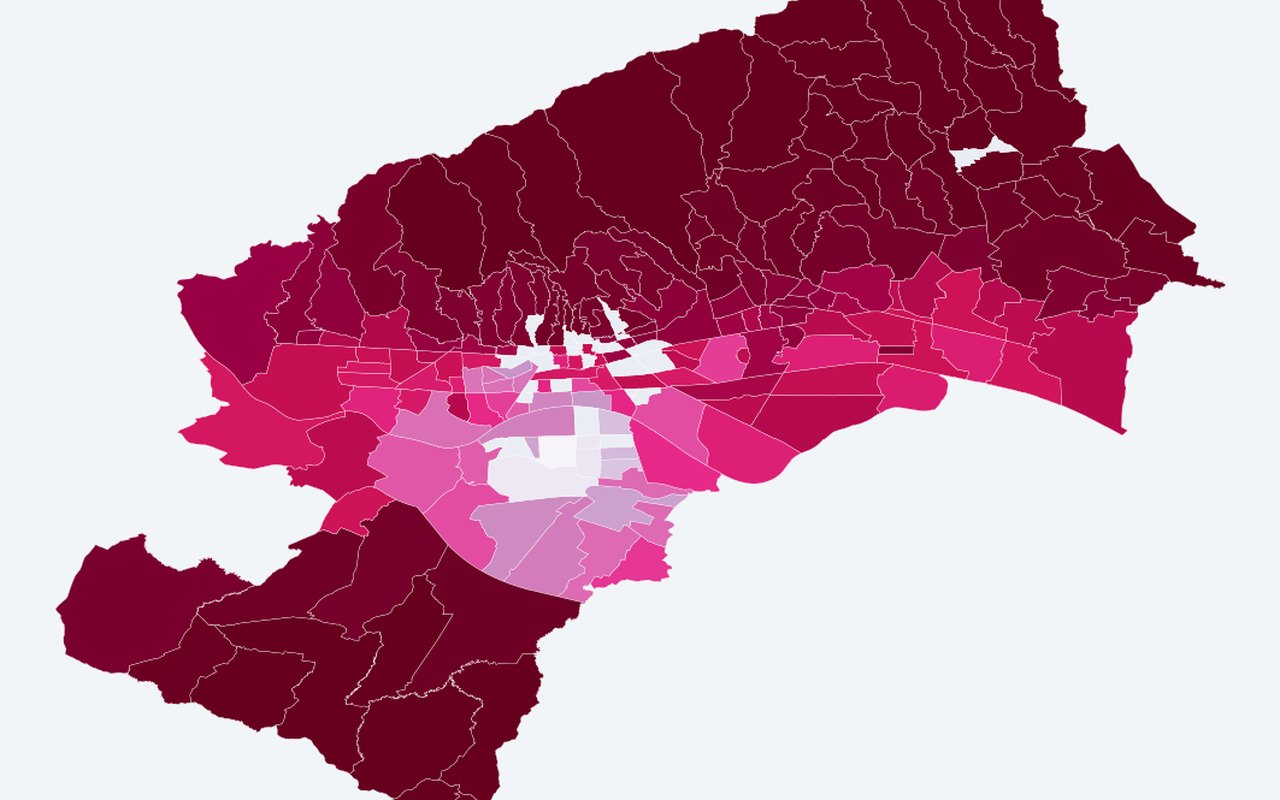
Mean nighttime land surface temperature from MODIS, averaged over summer. Warm nights (red, 24–28 °C) = heat retained overnight → dangerous for health because the body cannot recover from daytime heat stress. Cool nights (green, 12–16 °C) = effective cooling, typically vegetated/elevated areas. Resolution is ~1 km (neighbourhood scale).
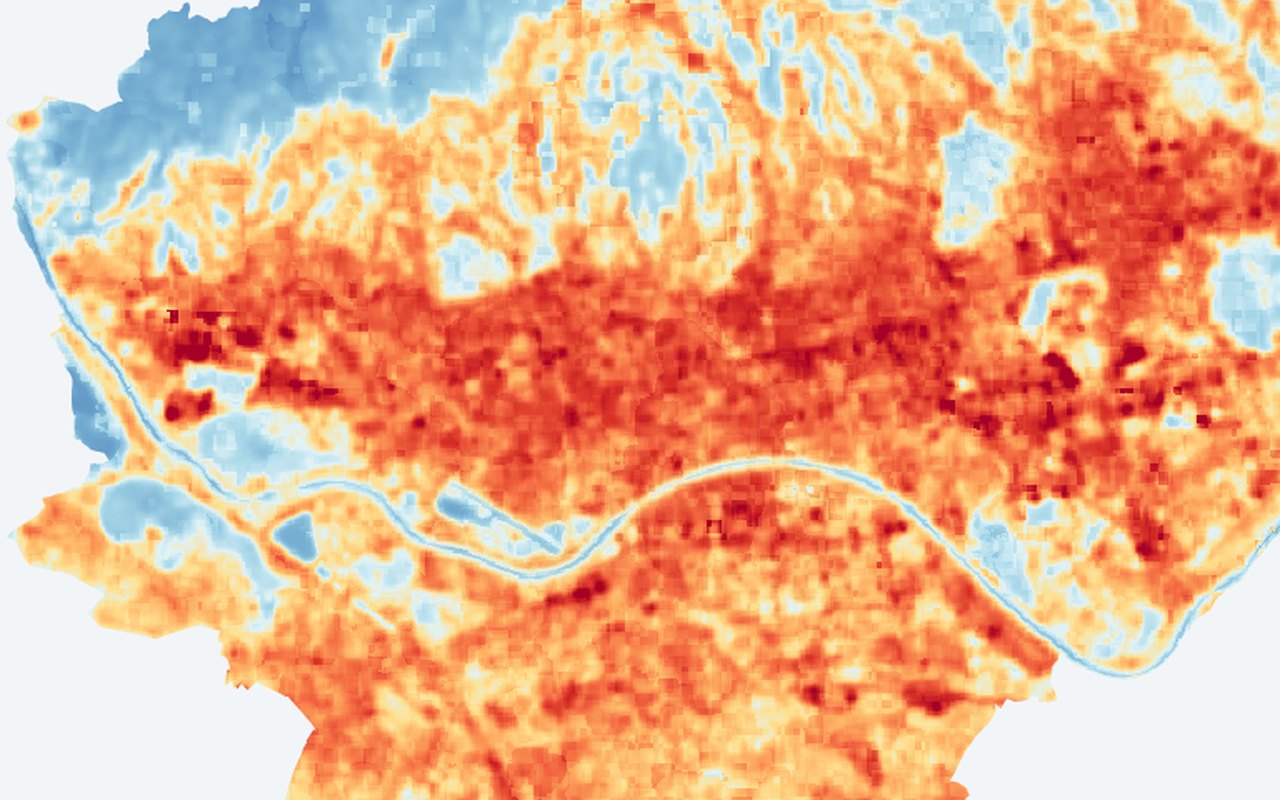
LST Z-Score (Anomaly)
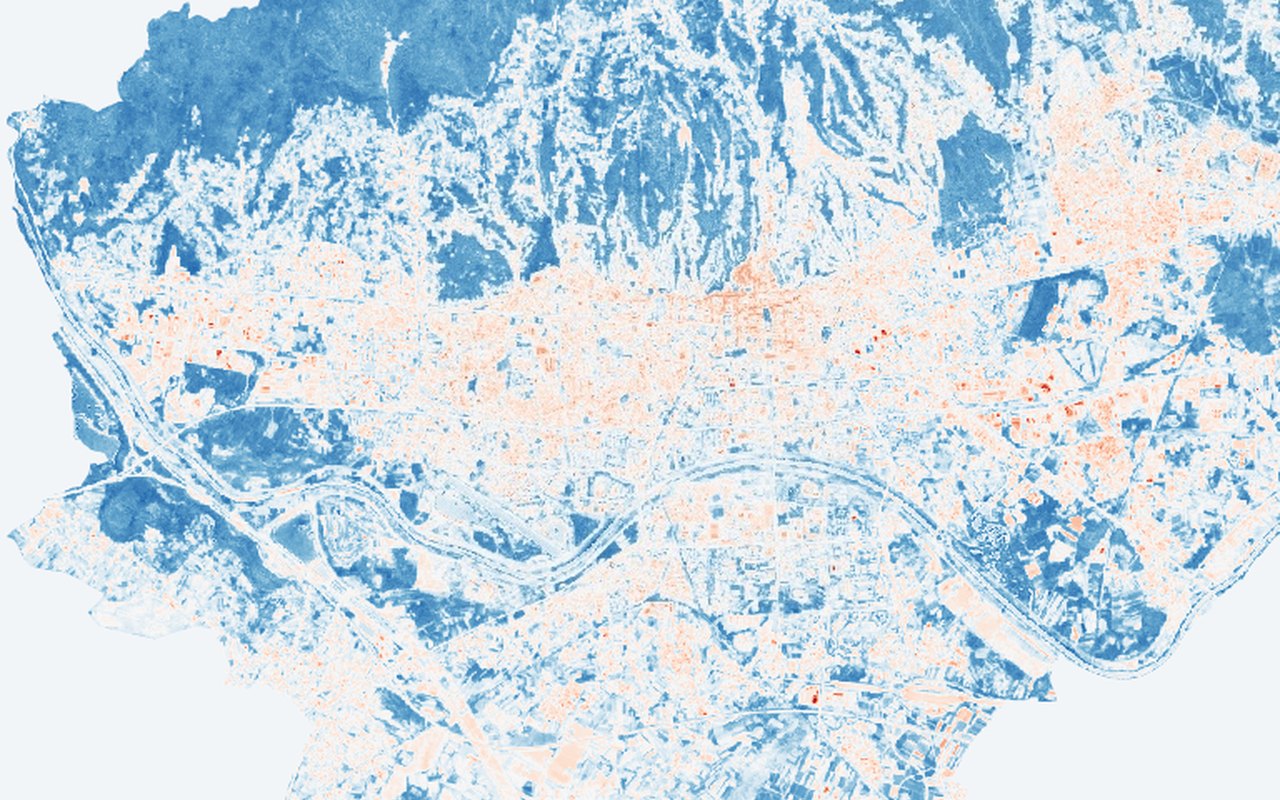
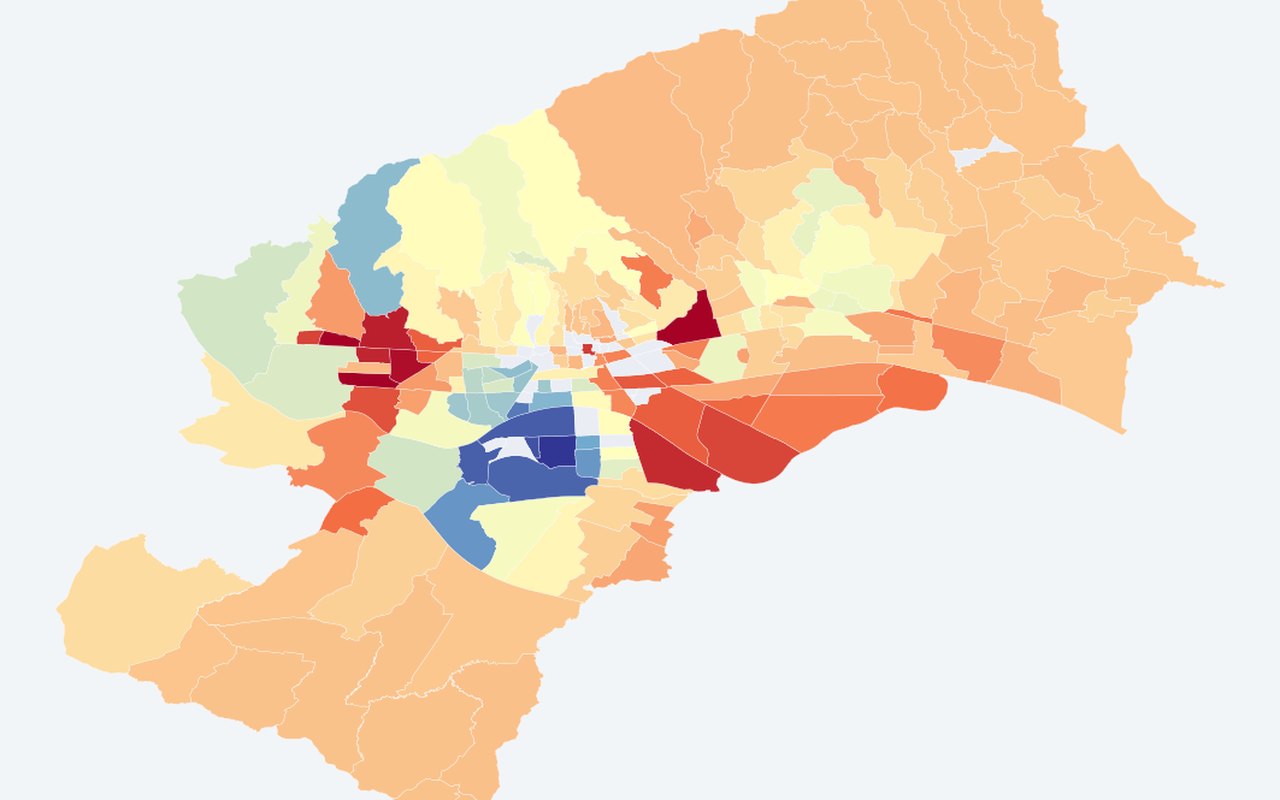
Z = (pixel land surface temperature − city mean land surface temperature) / city std-dev. Blue (negative Z) = cooler than average; red (positive Z) = hotter than average. A pixel at 35 °C in a city averaging 38 °C appears blue (cool spot) even though 35 °C is hot in absolute terms. Useful for identifying local anomalies that absolute temperature maps miss — e.g. a warm pocket inside a park.
LST Z-Score Classes (1-10)
10 fixed classes from extreme cold spot (class 1, Z ≤ −2.0) to extreme hot spot (class 10, Z > 2.0). Middle classes (5–6) are near-average. Class 1–4: progressively cooler than average. Class 7–10: progressively hotter than average. Simpler to interpret than continuous Z values — hand this to a policy maker and say 'red = act here'.
Urban Heat Exposure Index (UHEI)
UHEI = LST_norm + (1 − NDVI_norm) + (1 − Albedo_norm). Range: 0 (best) to 3 (worst). Green (low UHEI) = cool, vegetated, reflective surfaces. Red (high UHEI) = hot, bare, dark surfaces — where all three risk factors stack up. Differs from the Composite UHI Index (temperature minus vegetation greenness) by adding albedo as a third dimension: captures surface material reflectivity that vegetation greenness alone misses (e.g. light vs dark parking lots score differently).
Sentinel-2 NDVI (10 m)
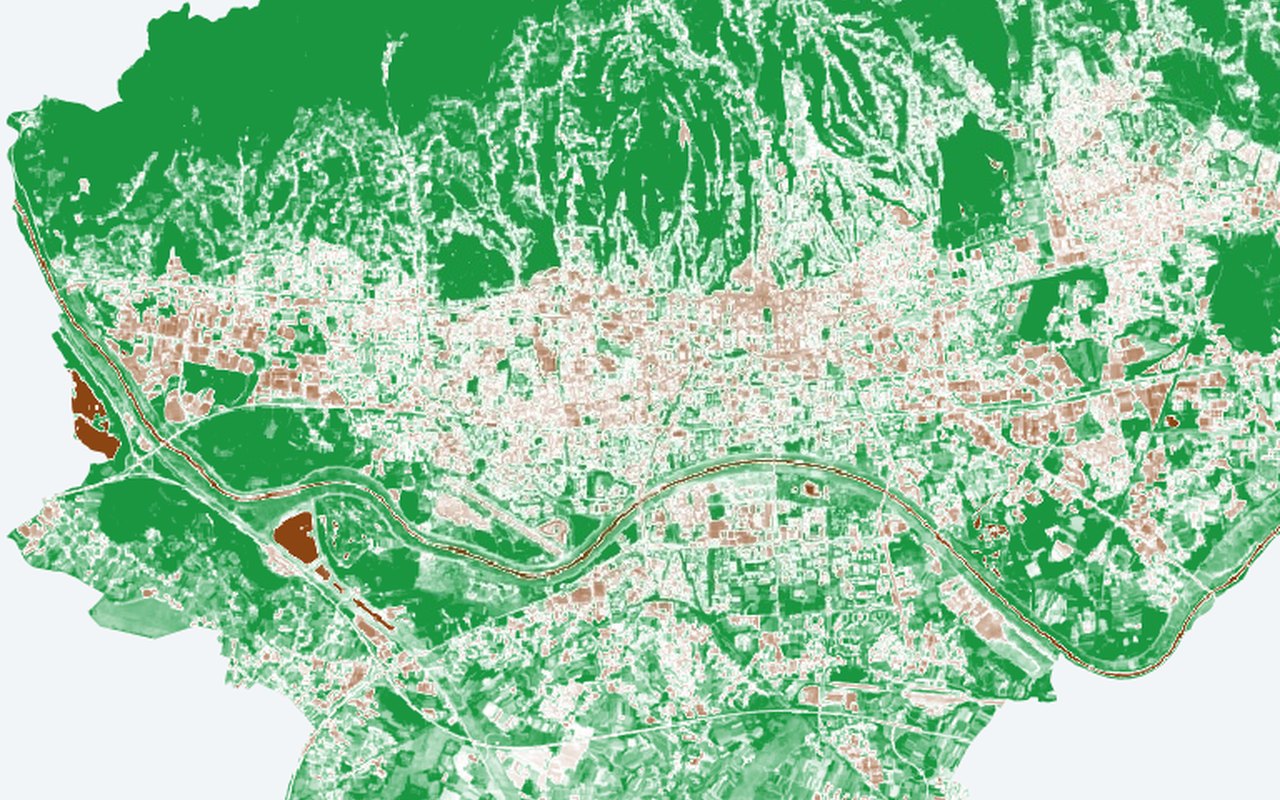
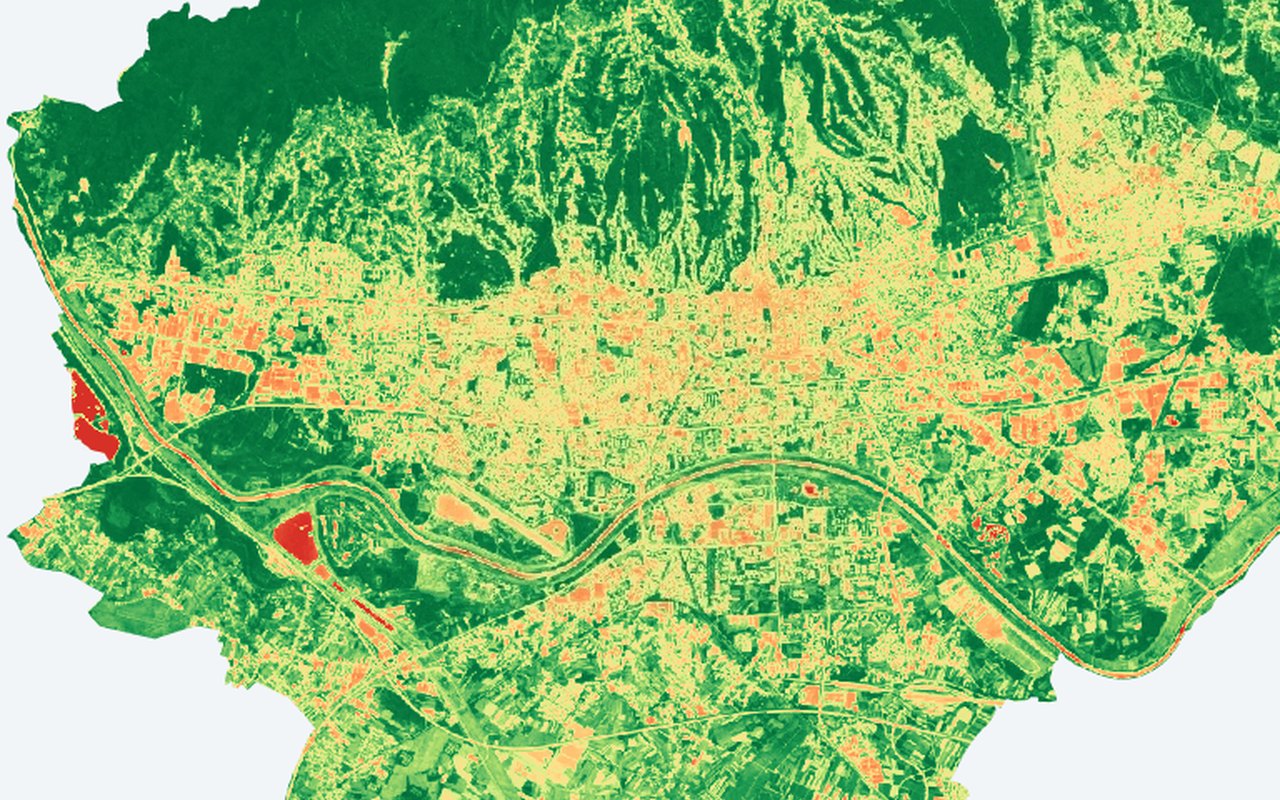
Normalized Difference Vegetation Index at 10 m from Sentinel-2 MSI. Dark green (vegetation greenness > 0.6) = dense healthy vegetation (parks, forests). Yellow (0.2–0.4) = sparse vegetation or irrigated turf. Red (< 0.1) = bare soil, asphalt, or water. Compare side-by-side with the 30 m Landsat vegetation greenness to see block-level detail that coarser imagery misses — individual tree canopies, courtyards, green roofs.
Sentinel-2 NDBI (10 m)
Normalized Difference Built-up Index. Red (built-up intensity > 0.1) = dense built-up or bare soil. Blue (built-up intensity < −0.2) = vegetation or water. Higher built-up intensity correlates with higher land surface temperature — use this to identify heat-driving surfaces.
Sentinel-2 NDWI (10 m)
Normalized Difference Water Index. Blue/green (NDWI > 0) = open water or saturated soil. Brown (NDWI < −0.3) = dry, built-up surfaces. Water bodies act as urban cooling sinks; visualize their extent at higher resolution.
Sentinel-5P NO₂ (TROPOMI)
Citywide nitrogen dioxide (NO₂) from satellite — a pollution backdrop that often follows traffic corridors and industrial areas.
CORINE Land Cover (100 m)
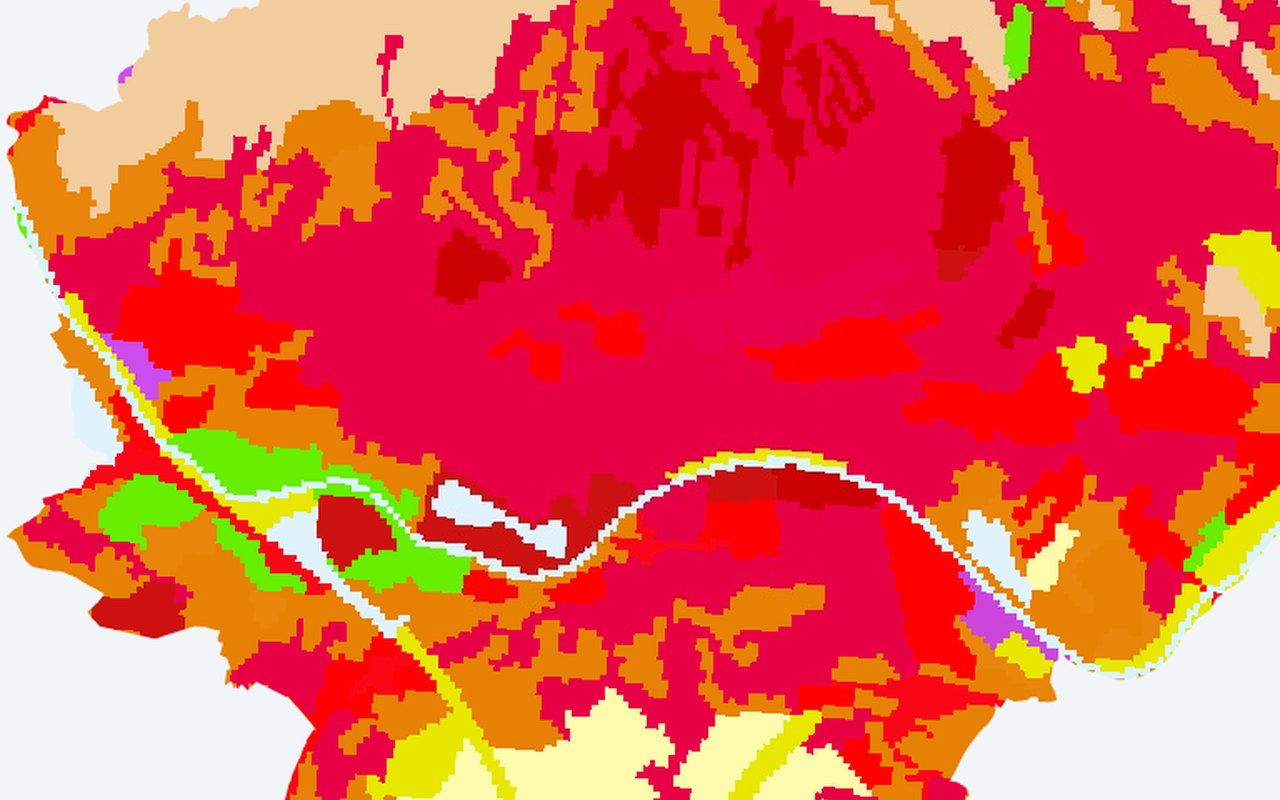
CORINE Level-3 land cover classification (100 m). Distinguishes continuous urban fabric (111) from discontinuous (112), industrial (121), road/rail (122), ports (123), airports (124), construction (133), green urban areas (141), sport/leisure (142), arable (211), vineyards (221), forests (311–313), wetlands, water bodies, and more. Ideal for correlating land-use CLASS (not just cover) with UHI intensity — e.g. 'industrial zones are 3 °C hotter than discontinuous residential'.

Findings
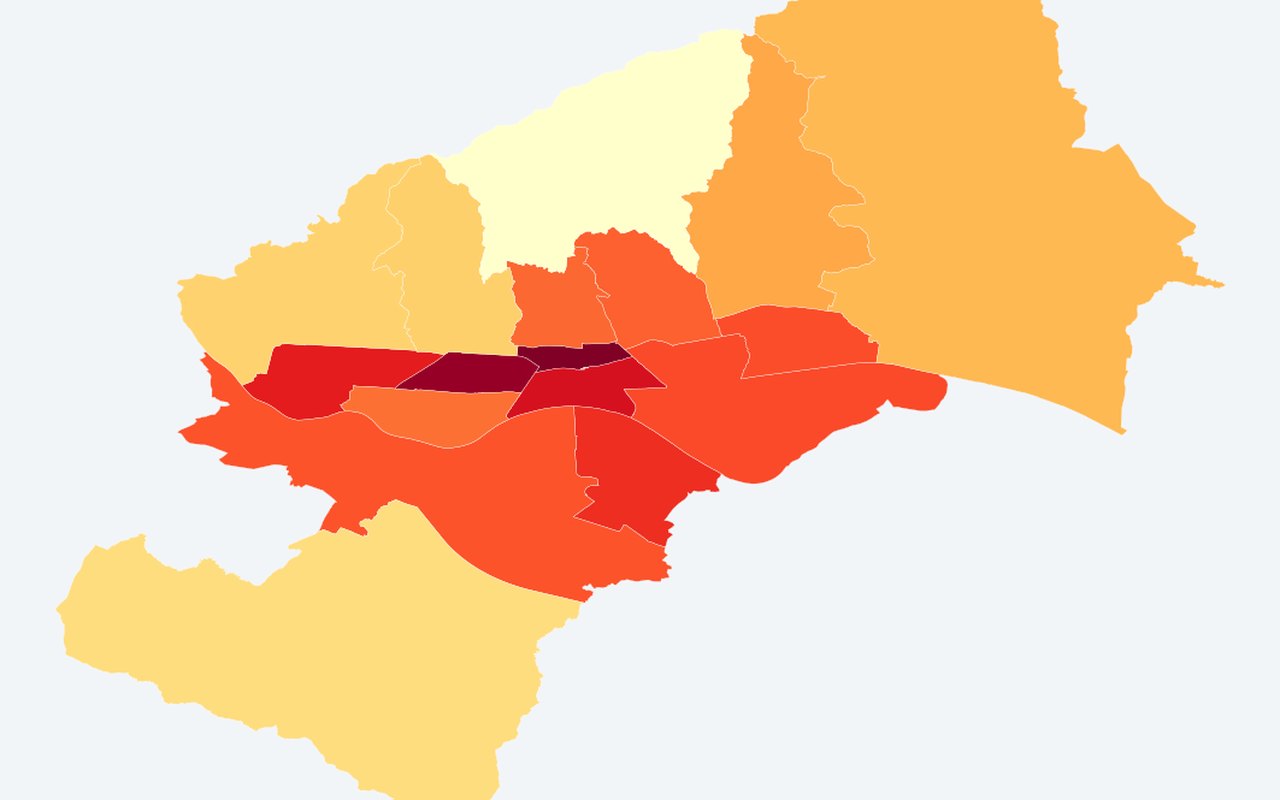
11UHI Anomaly per Neighborhood (ΔT °C)
Mean land surface temperature minus a rural reference (WorldCover non-urban classes). Positive = hotter than rural. District mean land surface temperature minus rural reference.
Mean LST per Neighborhood (°C)
Mean Land Surface Temperature (°C) over the analysis window. District mean land surface temperature.
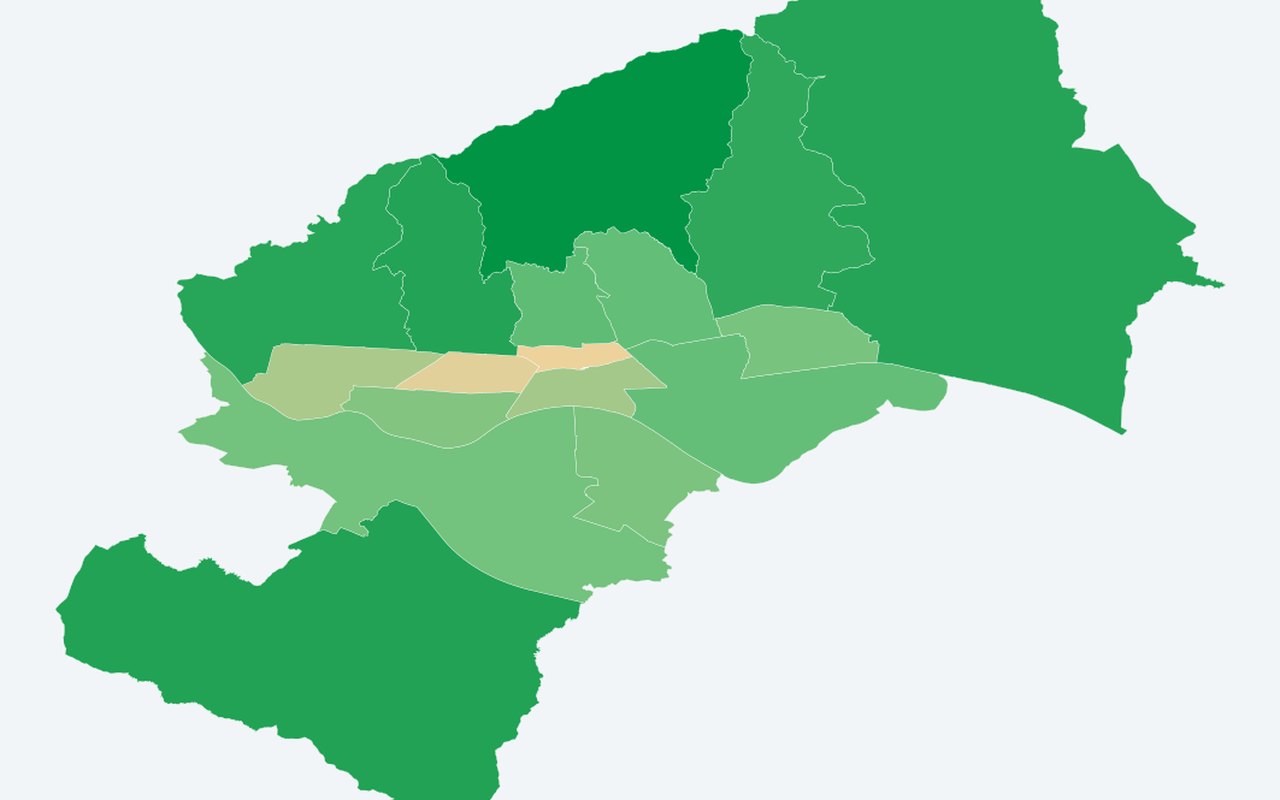
Mean NDVI per Neighborhood (Greenness)
Mean vegetation greenness per polygon (range −1 to +1, higher = greener). District mean vegetation greenness (greenness).
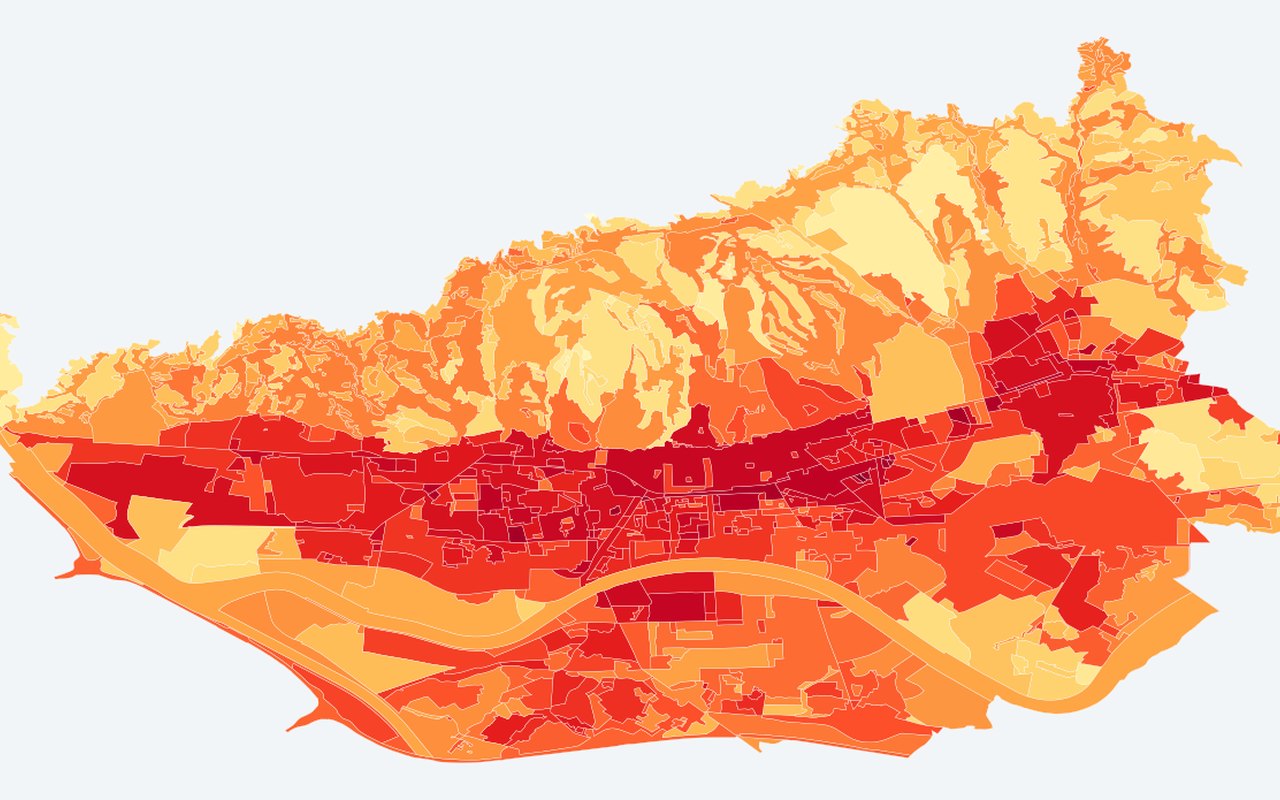
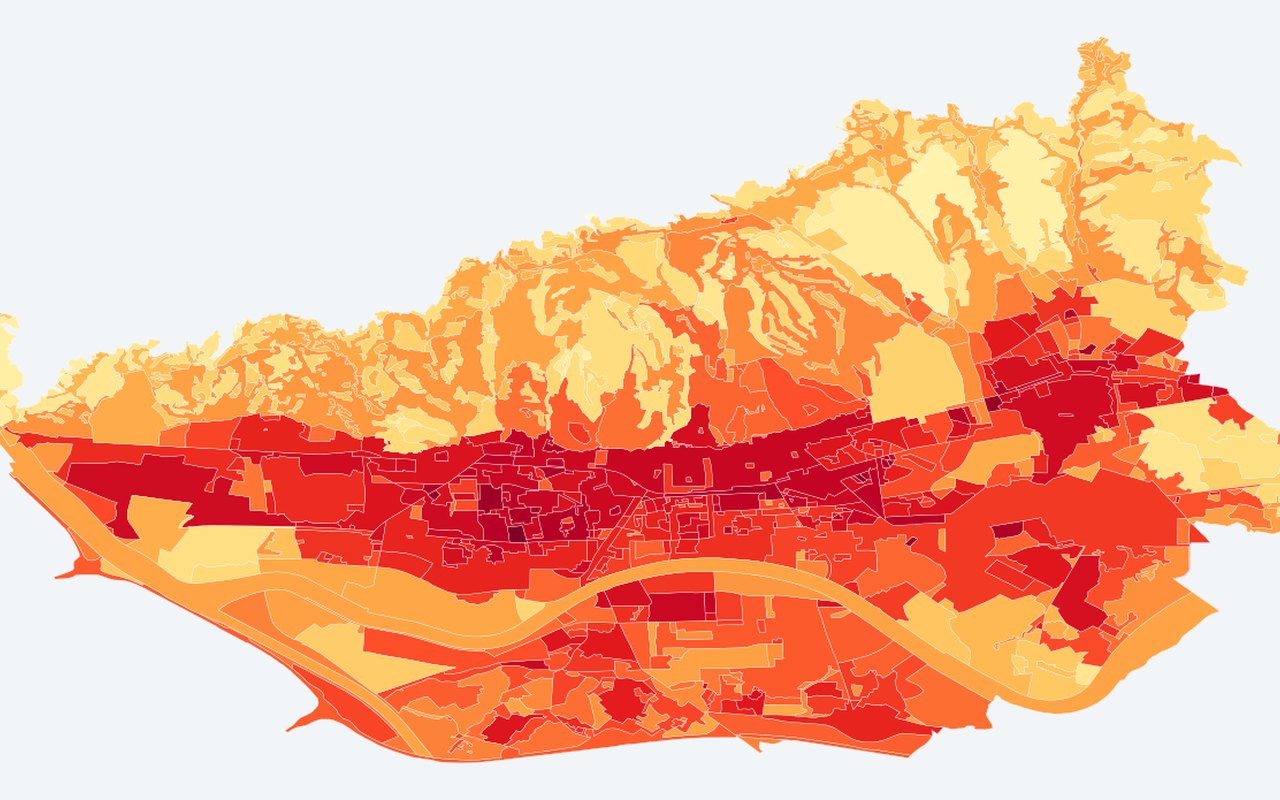
Composite UHI Index (MDPI 2025)
A published-style composite urban heat index that combines surface temperature with vegetation greenness on Zagreb planning polygons. Higher values mean a stronger heat-island signature in index space.
Composite UHI Index 2024 (MDPI Paper Dates)
Per-Urbana-pravila polygon: temperature minus vegetation greenness, computed on the original 2024 imagery dates used in the paper (Bečić & Gašparović, Land 2025). Higher value = stronger UHI signature in index space.
LISA Clusters (HH/LL/HL/LH)
HH = heat cluster, LL = cool cluster, HL/LH = outliers. Grey = not significant at p < 0.05. Local Moran's I heat clusters.
LISA Clusters 2024 (HH/LL/HL/LH)
HH = heat cluster, LL = cool cluster, HL/LH = outliers. Grey = not significant at p < 0.05. Based on the 2024 paper-date composite.
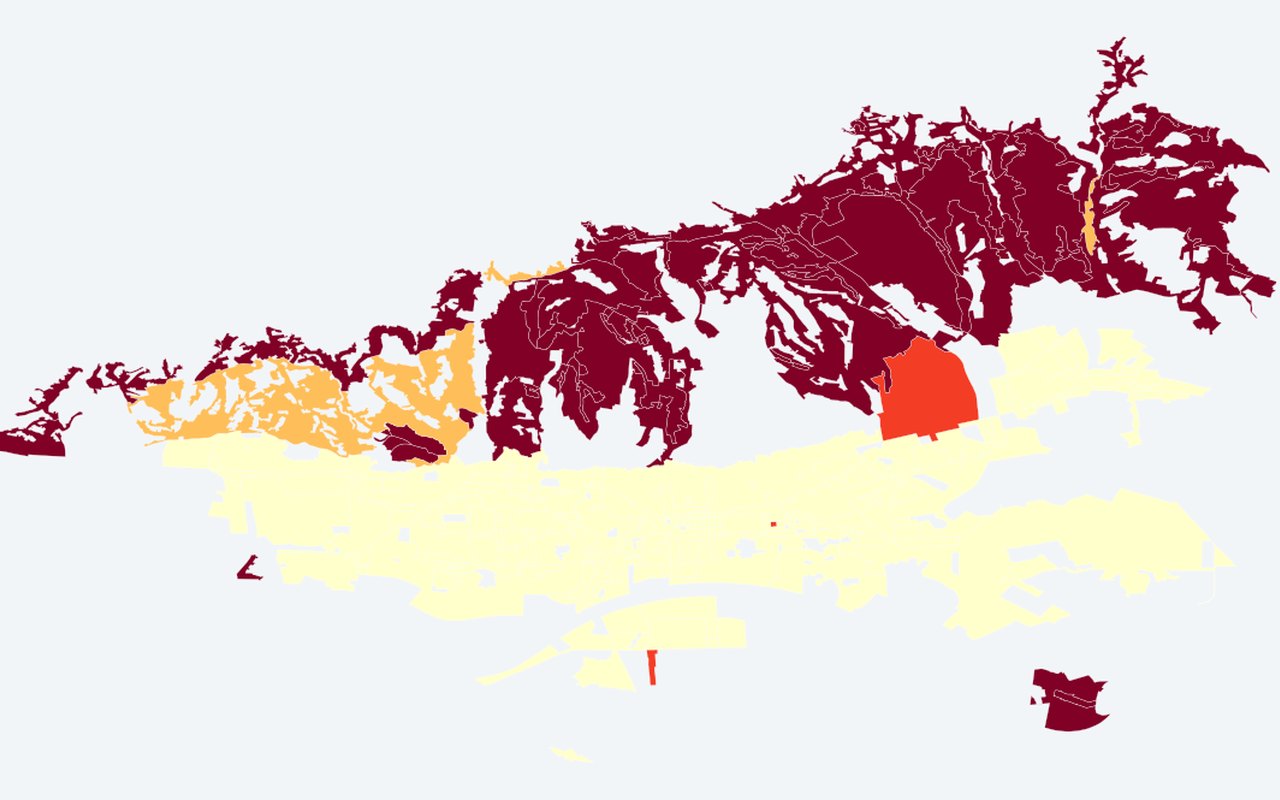
Thermal-Priority Parcels
Residential/mixed-use GUP parcels with enough Landsat pixels where vegetation greenness < threshold AND land surface temperature > threshold (parcel fill + priority pixel count in tooltip).
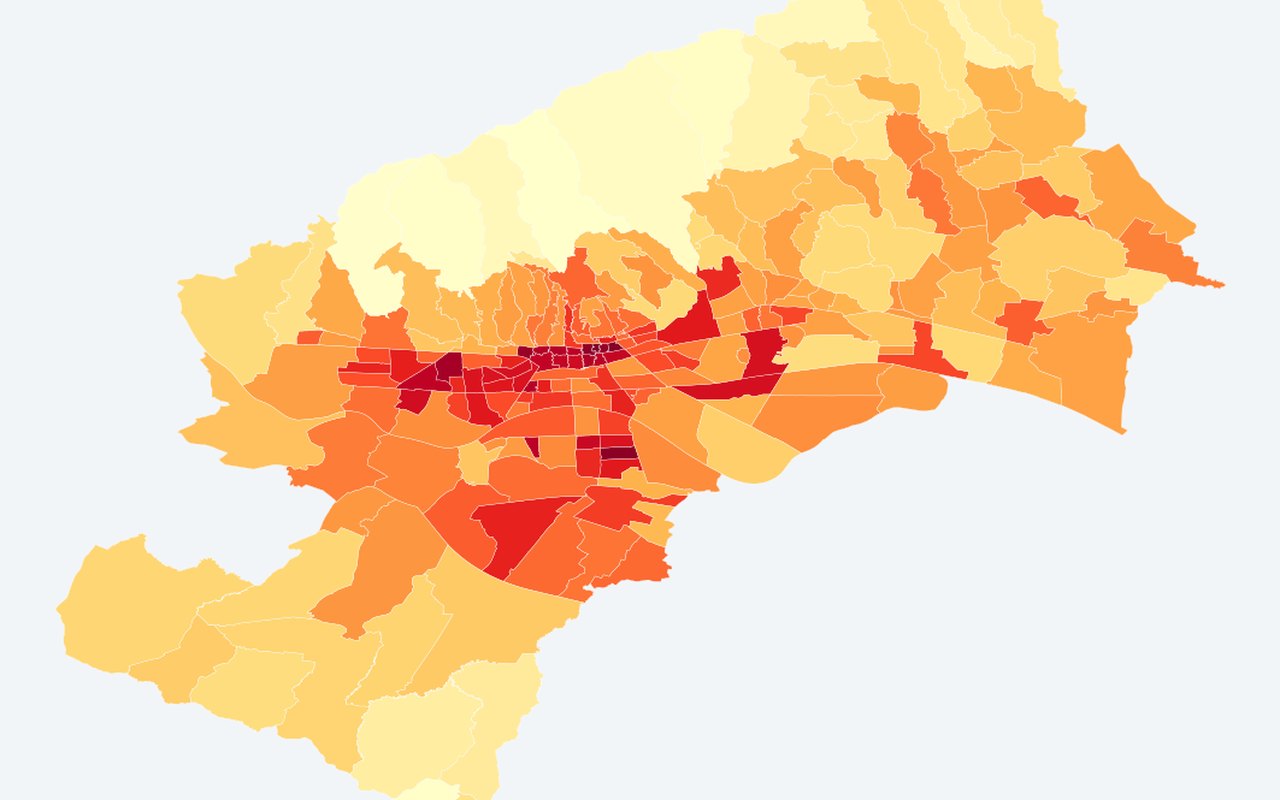
Heat vulnerability index (HVI)
A single neighbourhood score combining heat, elderly share, density, greenness gaps, and heatwave days. Higher values mark places where heat and sensitive populations overlap.
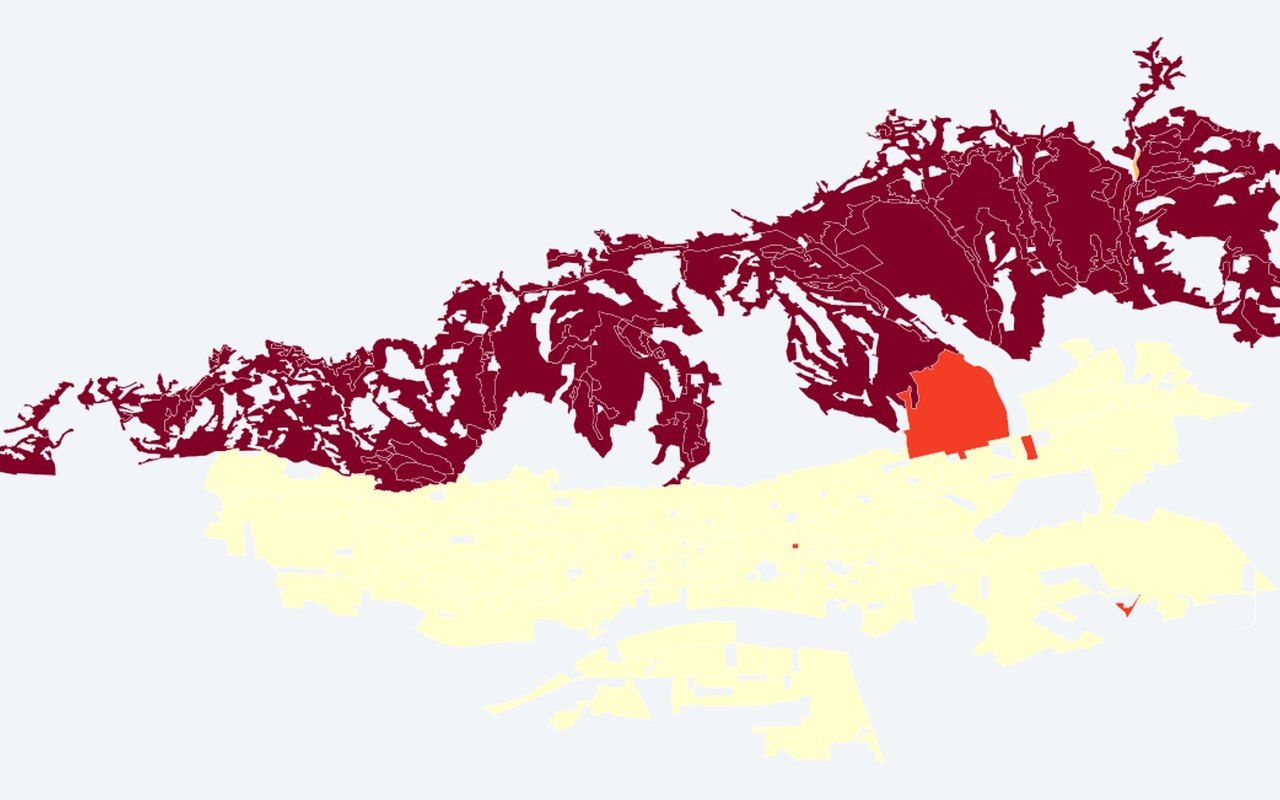
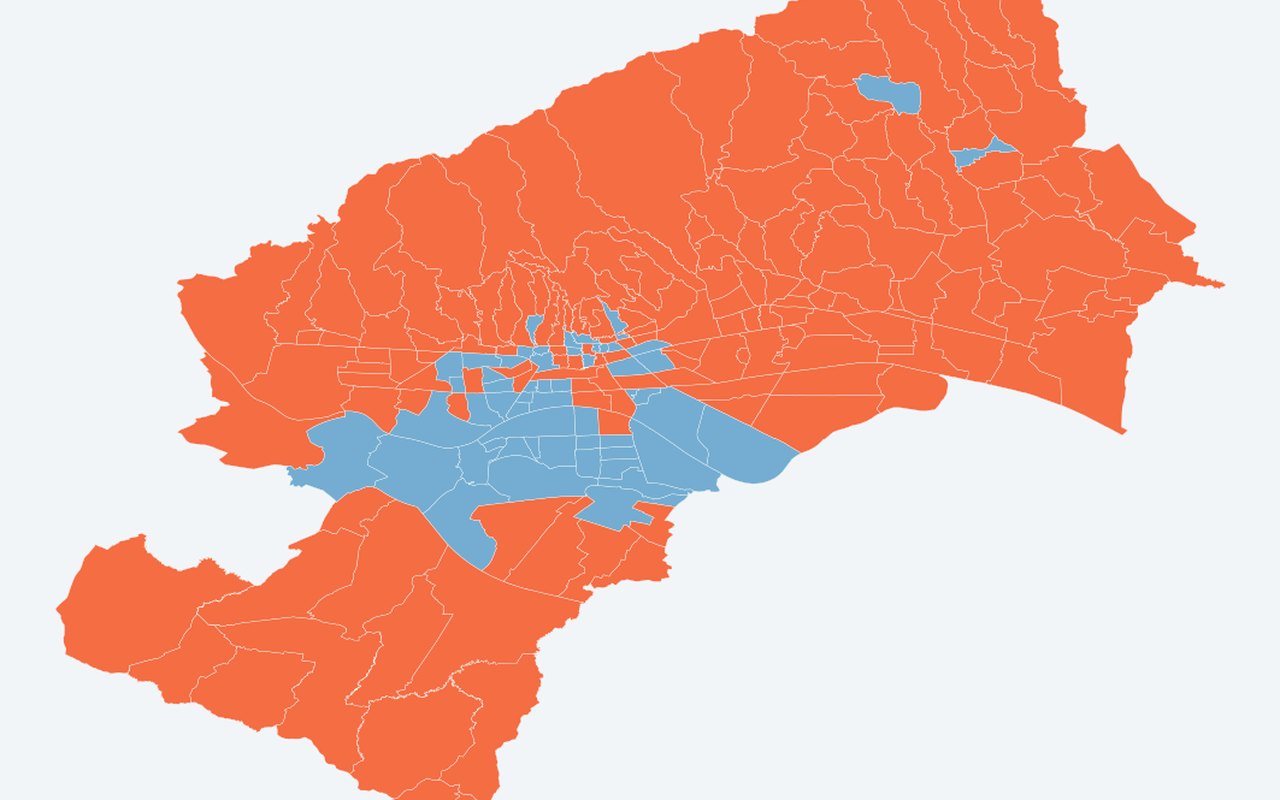
Hot districts
District polygons classified Hot vs Other using mean UHI anomaly ≥ 75th percentile. Districts above the city ΔT hot threshold.
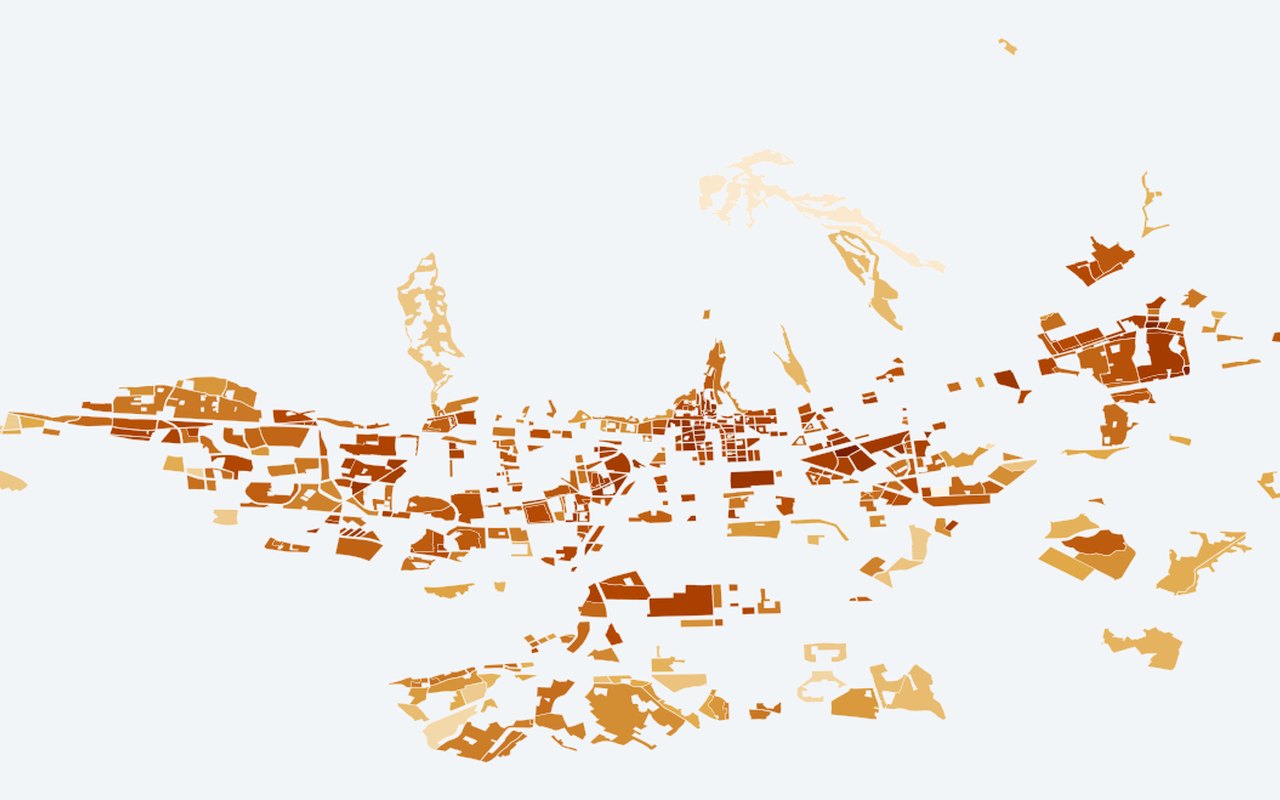
Street hotspot ranking
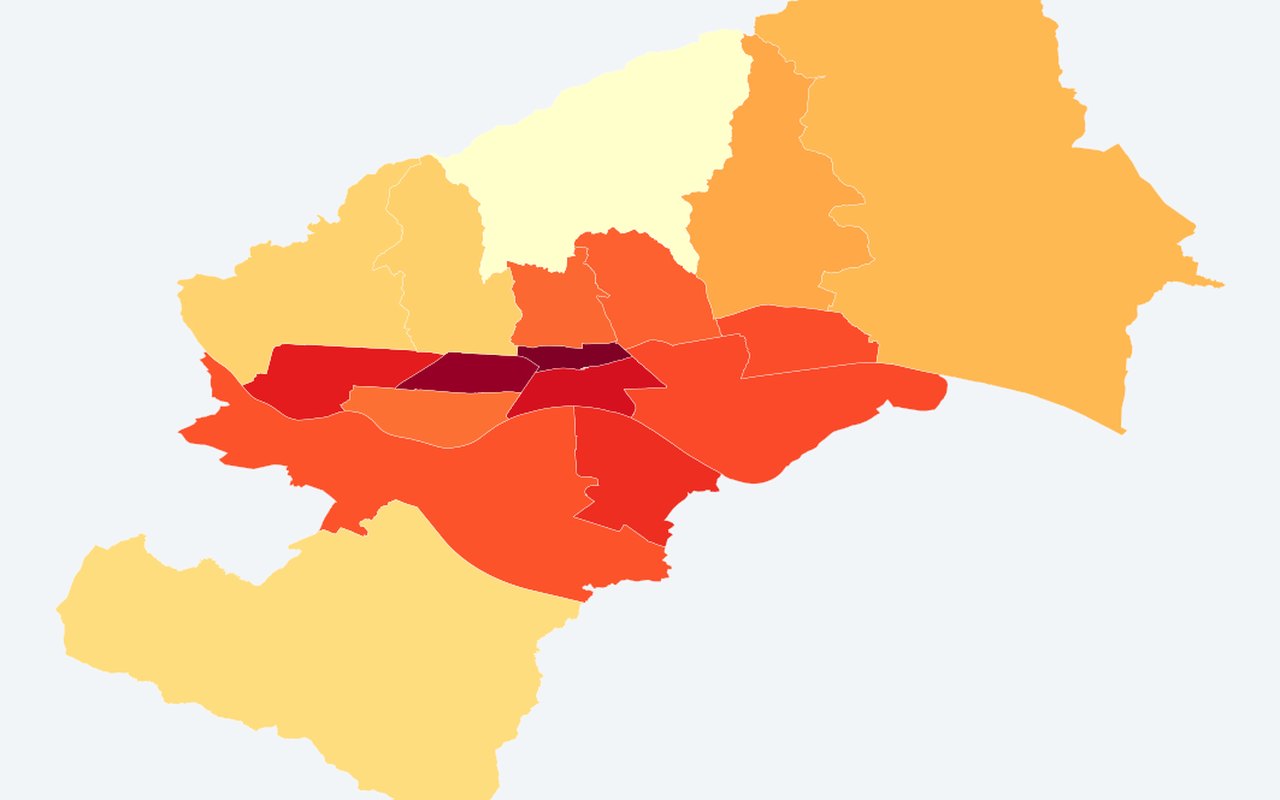
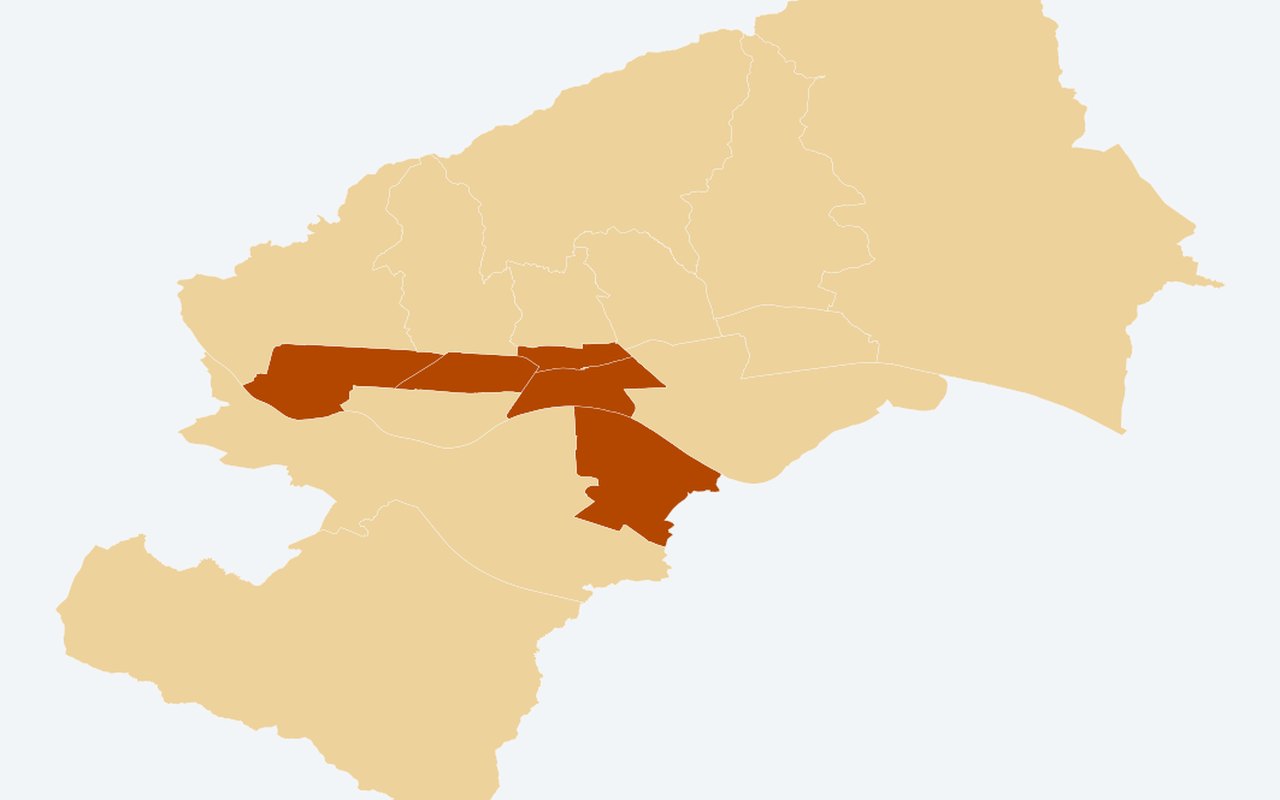
A small set of pilot street segments ranked by how hot their surfaces are. Higher scores mark streets that may need shade or greening first.
Vulnerability & census
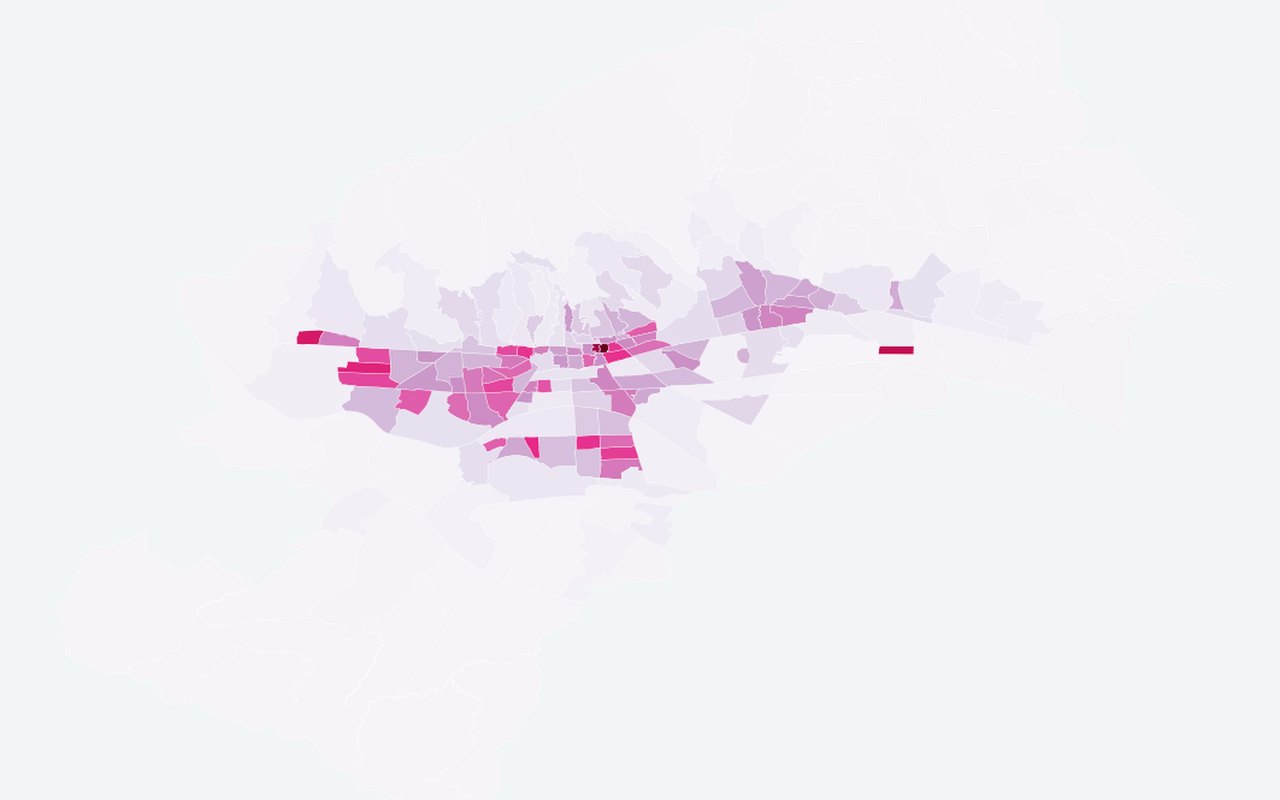
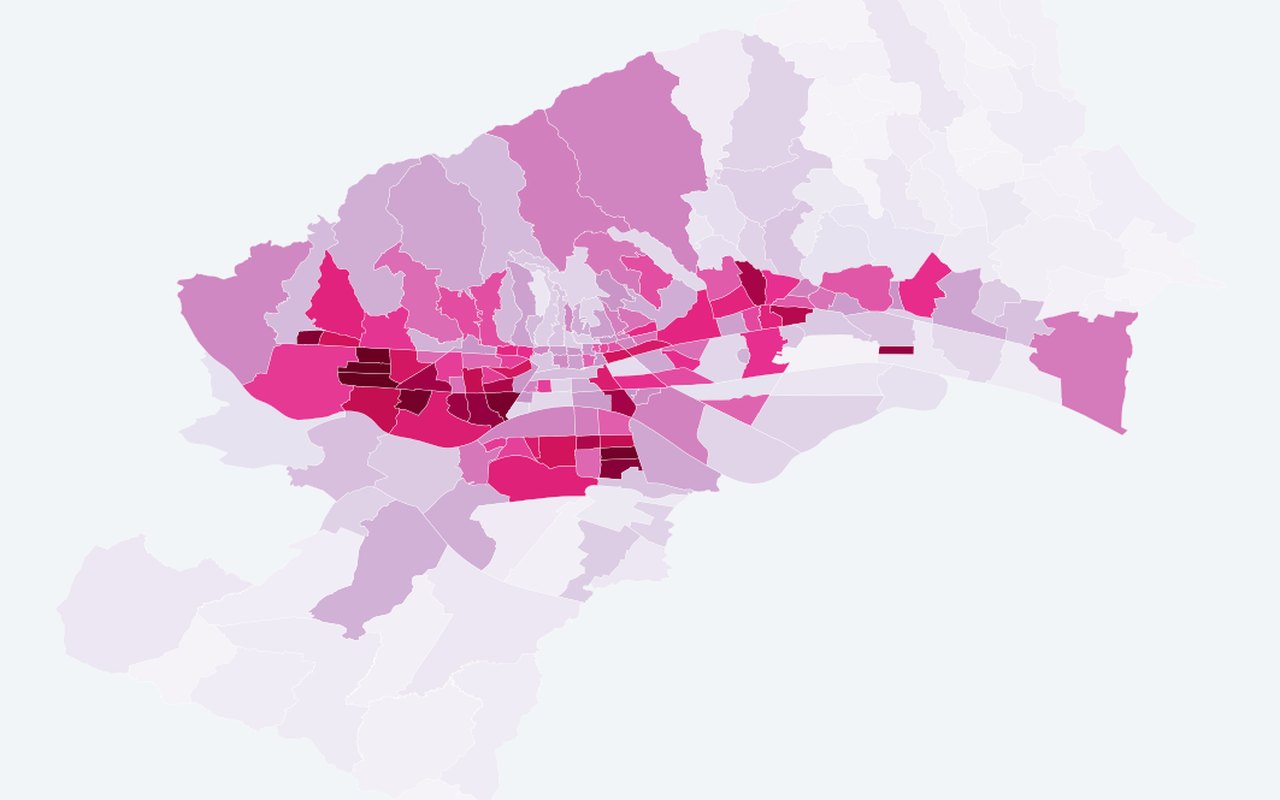
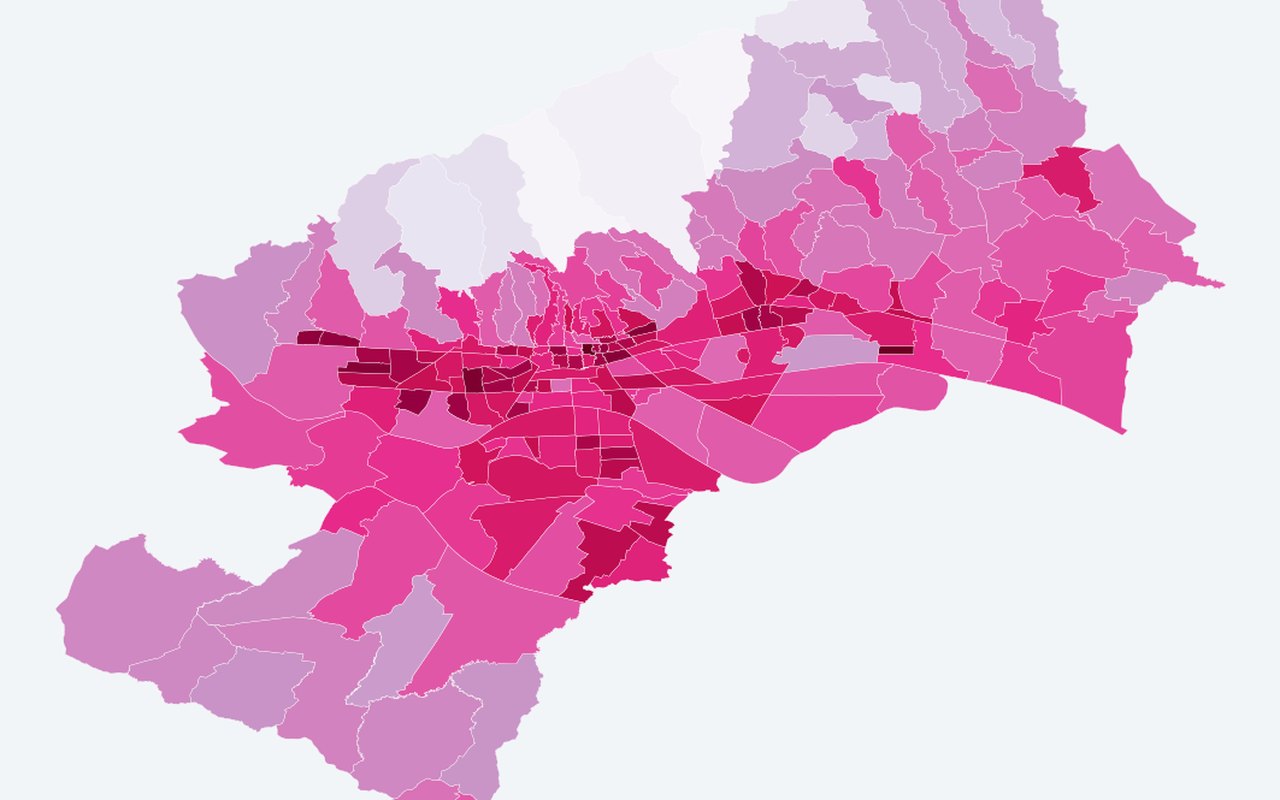
16Elderly × warm night LST — MO
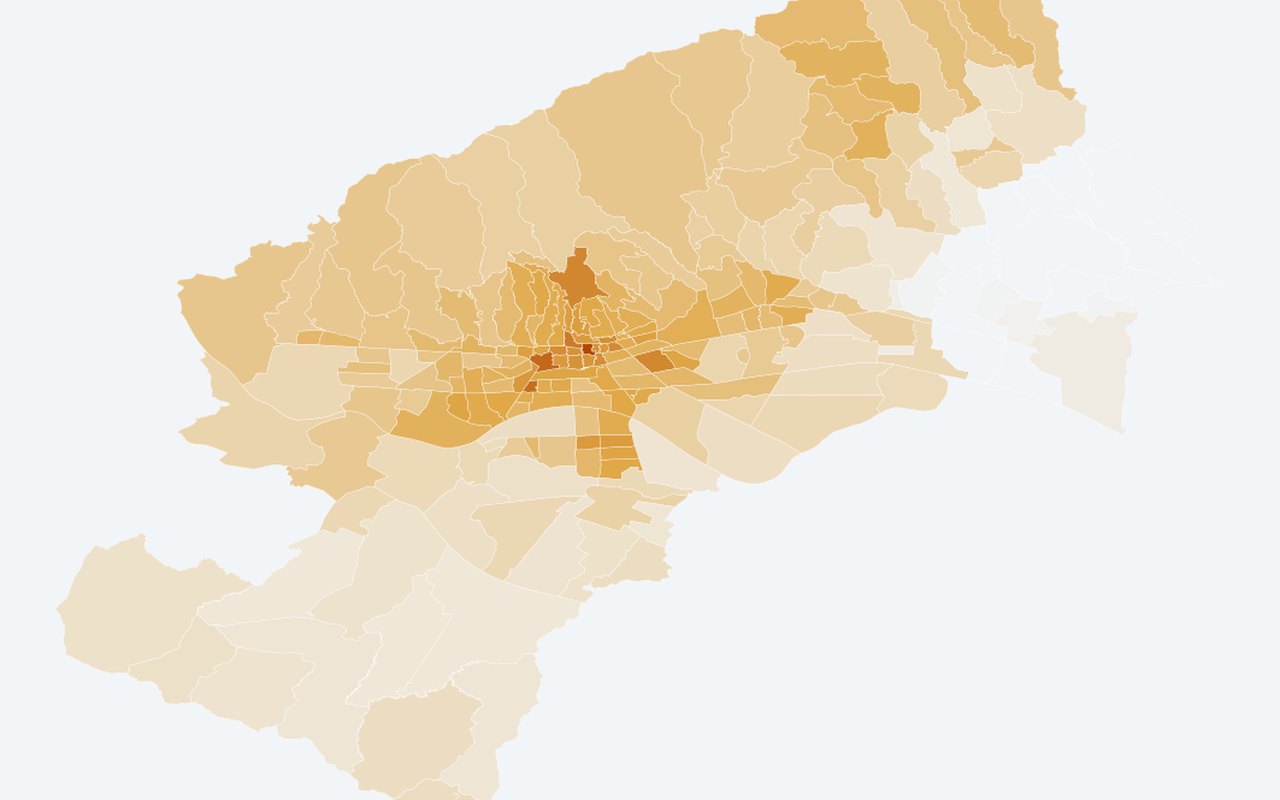
0–1 score: elderly_share × ranked night land surface temperature (neighbourhood-level). Elderly share overlapping warm night-land surface temperature neighbourhoods.
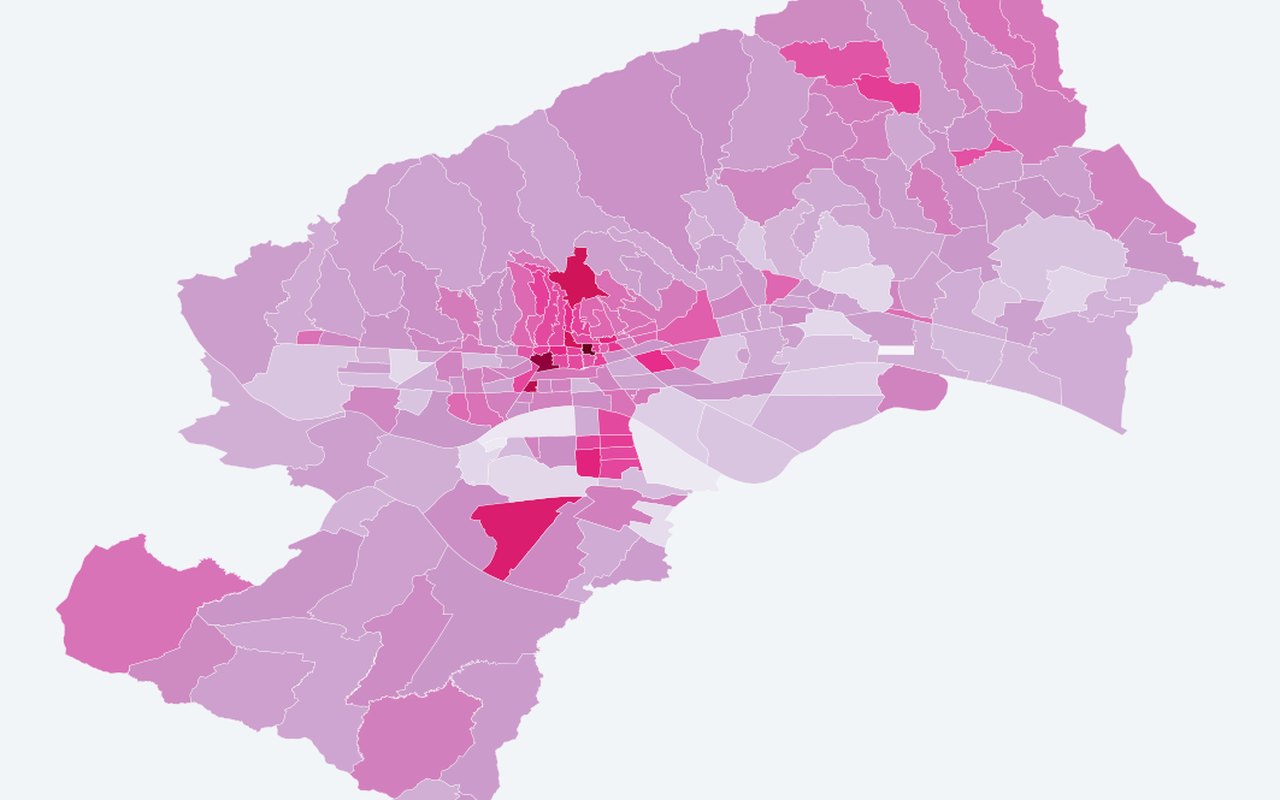
Elderly heat exposure score — MO
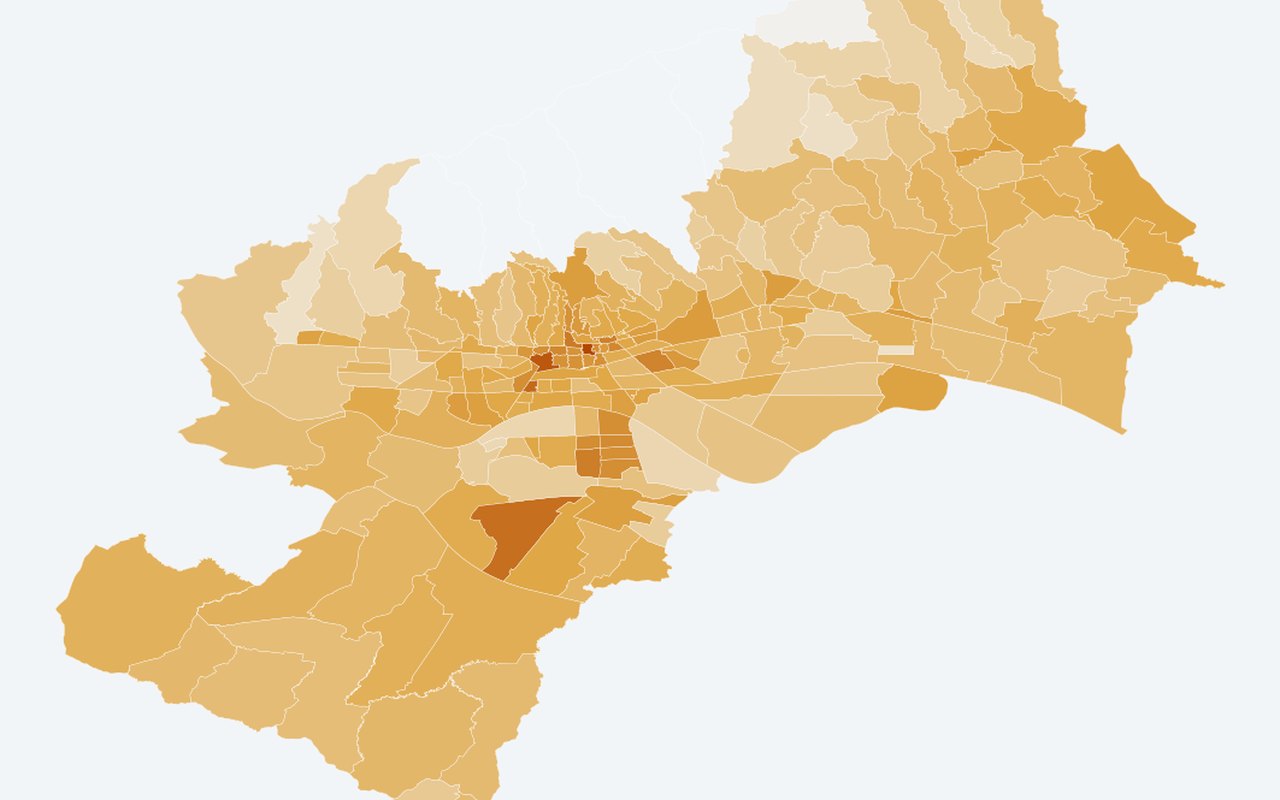
0–1 score: elderly_share × robust_norm(estimated_air_temp_2m_C). Spatial detail comes from **census**, not ERA5-Land air.
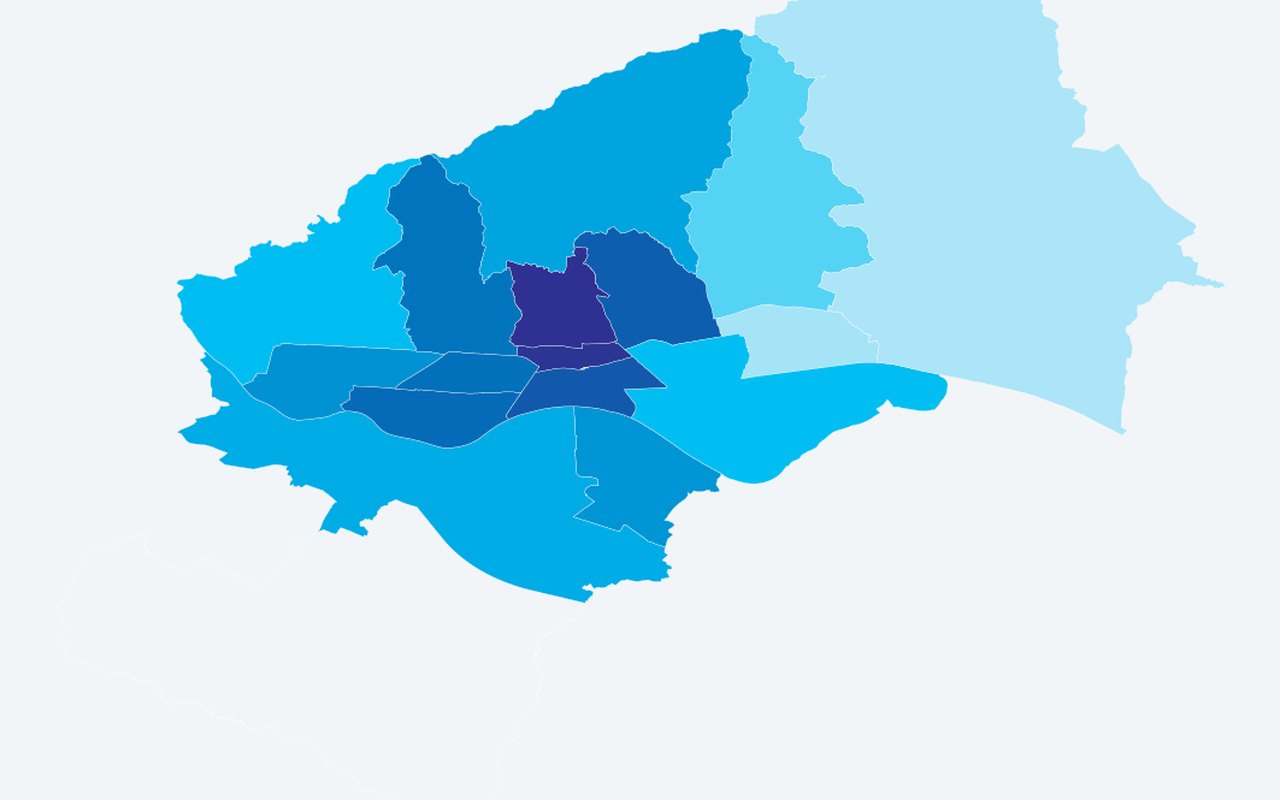
Population density — MO polygons (light fill)
Light blue choropleth on population_density; colour bar spans **neighbourhood 2nd–98th** density percentiles (values outside saturate). Not the combined 0.6×pop + 0.4×density planning index. **Off by default** on the integrated map.
Elderly share 65+ — MO polygons (2021)
Fill colour from elderly_share (0–1). Tooltip/popup include formatted percentage columns. **Off by default** (toggle with population density for comparison).
Children share 0–14 — MO polygons (2021)
Fill colour from children_share (0–1); legend uses a robust neighbourhood-only band (2–98%iles, fallback 0–1) so clustered shares use the colour scale. Tooltip/popup include formatted percentage columns. **Off by default.**.
Working-age share 15–64 — MO polygons (2021)
Fill colour from working_share (0–1); legend uses a robust neighbourhood-only band (2–98%iles, fallback 0–1) for clustered shares. Tooltip/popup include formatted percentage columns. **Off by default.**.
Census 2021: MO polygons (combined index, click for popup)
neighbourhood fill coloured by combined index; click for counts, density, age shares (% of total). Separate pane from density and share fills; still below land surface temperature map tiles on the integrated map.
Education 2021: education table (by district)
Green choropleth by higher-education share; hover or click a district for all Tabela 2 counts and shares. Share with higher education by city district.
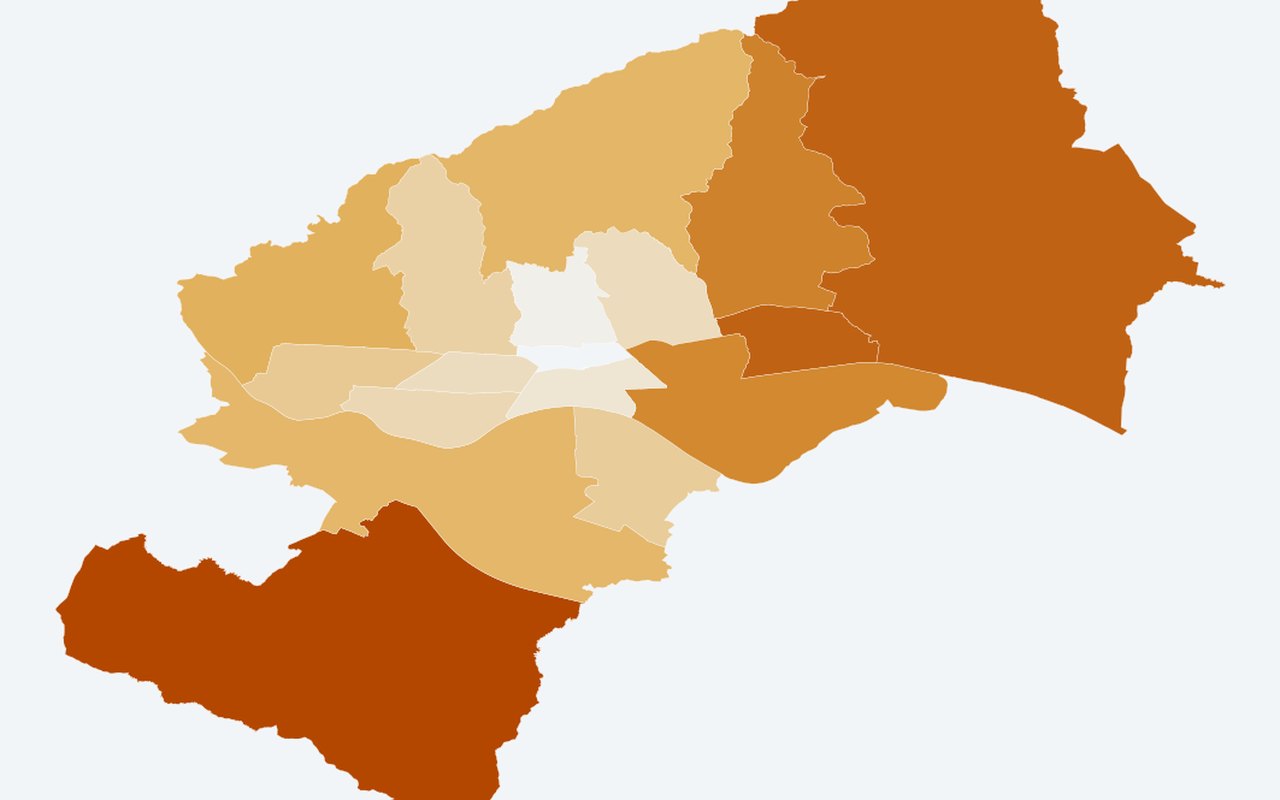
Education 2021: least educated districts (low formal schooling)
Darker orange = higher share_low_formal_education (no school + primary grades 1–7 + completed primary only). Share with primary schooling only (proxy for lower formal education).
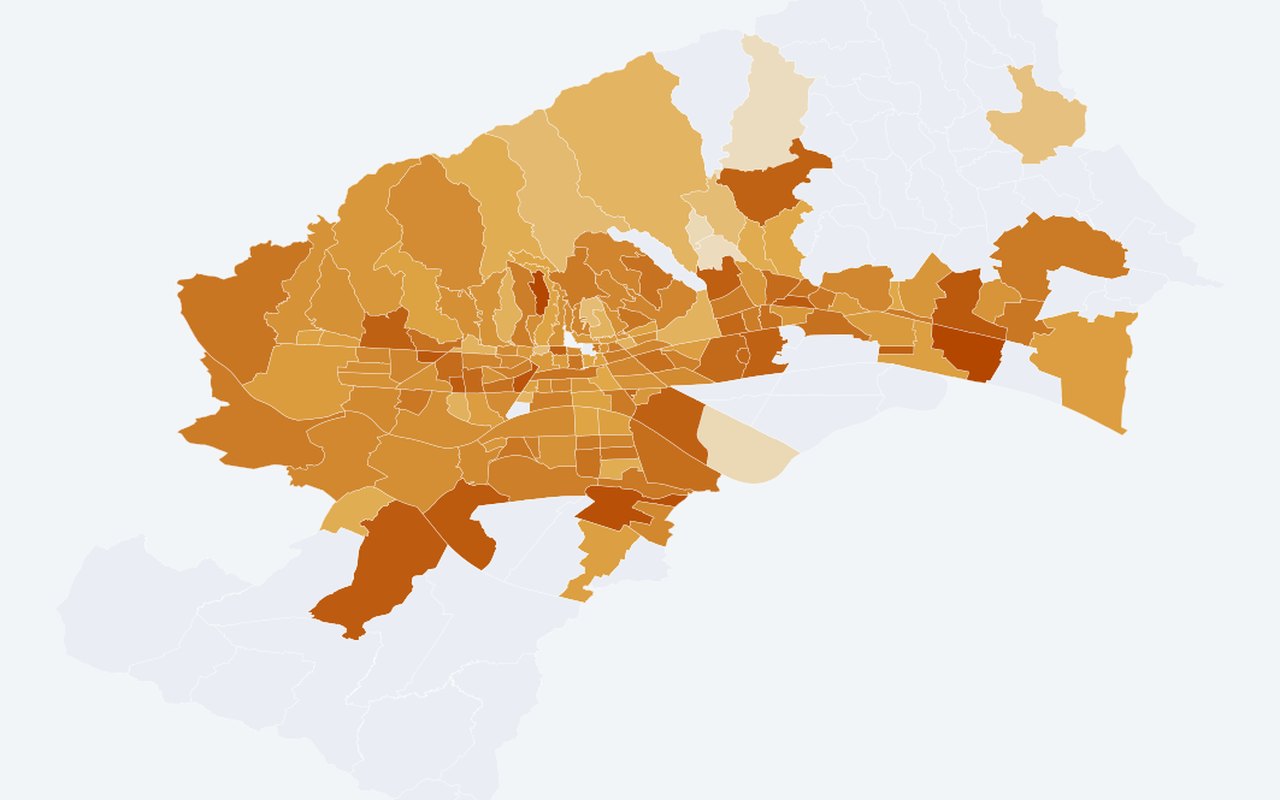
Citizen survey heat burden
Survey-derived heat-burden and vulnerability indicators on neighbourhood or district polygons. Self-reported heat burden index (neighbourhood).
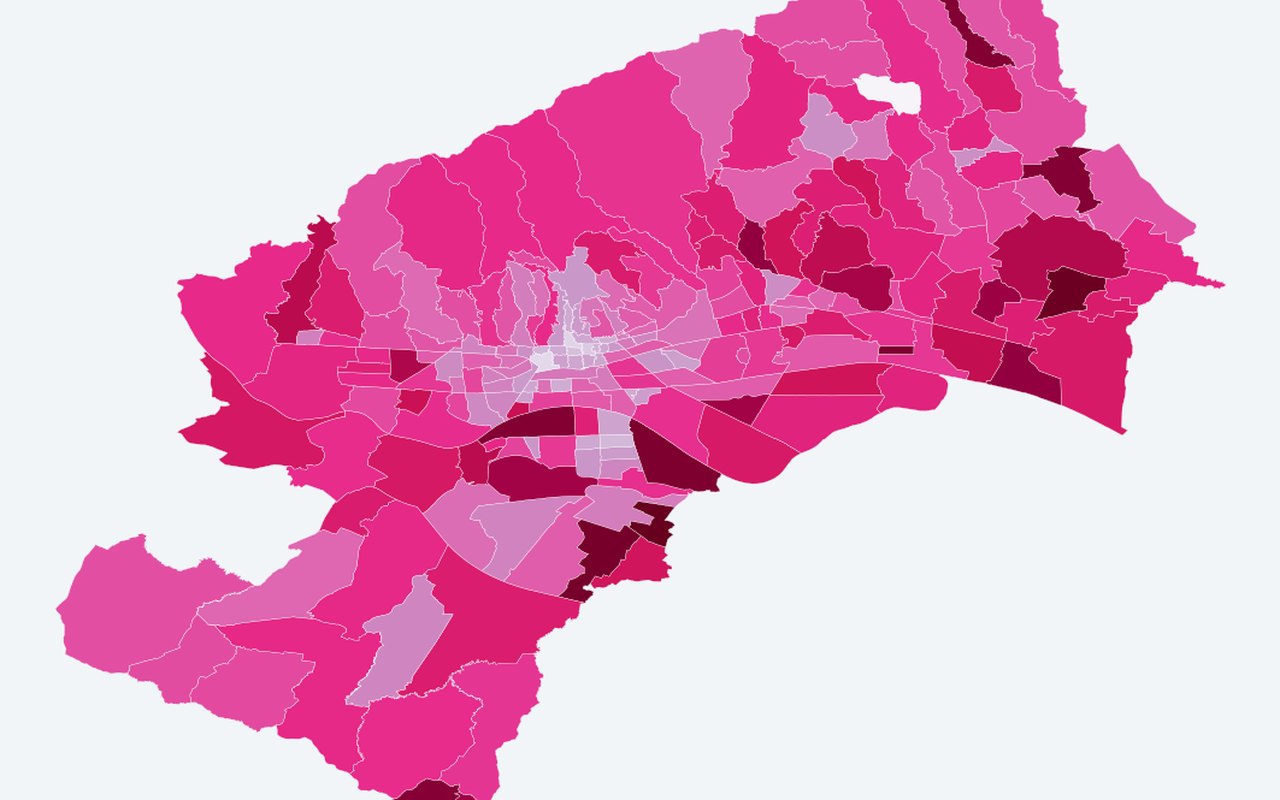
Heat Risk Population Index (HRPI) — 2024 (Earth 2026)
A neighbourhood heat-risk score that blends summer air and surface temperature with demographic sensitivity and population density. Higher values mean more combined heat and people at risk.
GWR local β (demographic sensitivity) — Earth 2026
Local β_DSI from adaptive bisquare local regression (heat risk index ~ demographic sensitivity + land surface temperature + air temperature). Higher = stronger local demographic effect.
GWR local R² — Earth 2026
Local R² from local regression windows (0–1). Peripheral neighbourhoods often show higher fit than complex central zones.
Heat-risk dominant driver (climate vs demography)
Climate-driven vs demography-driven classification from |β×component| magnitudes (climate uses land surface temperature + air temperature).
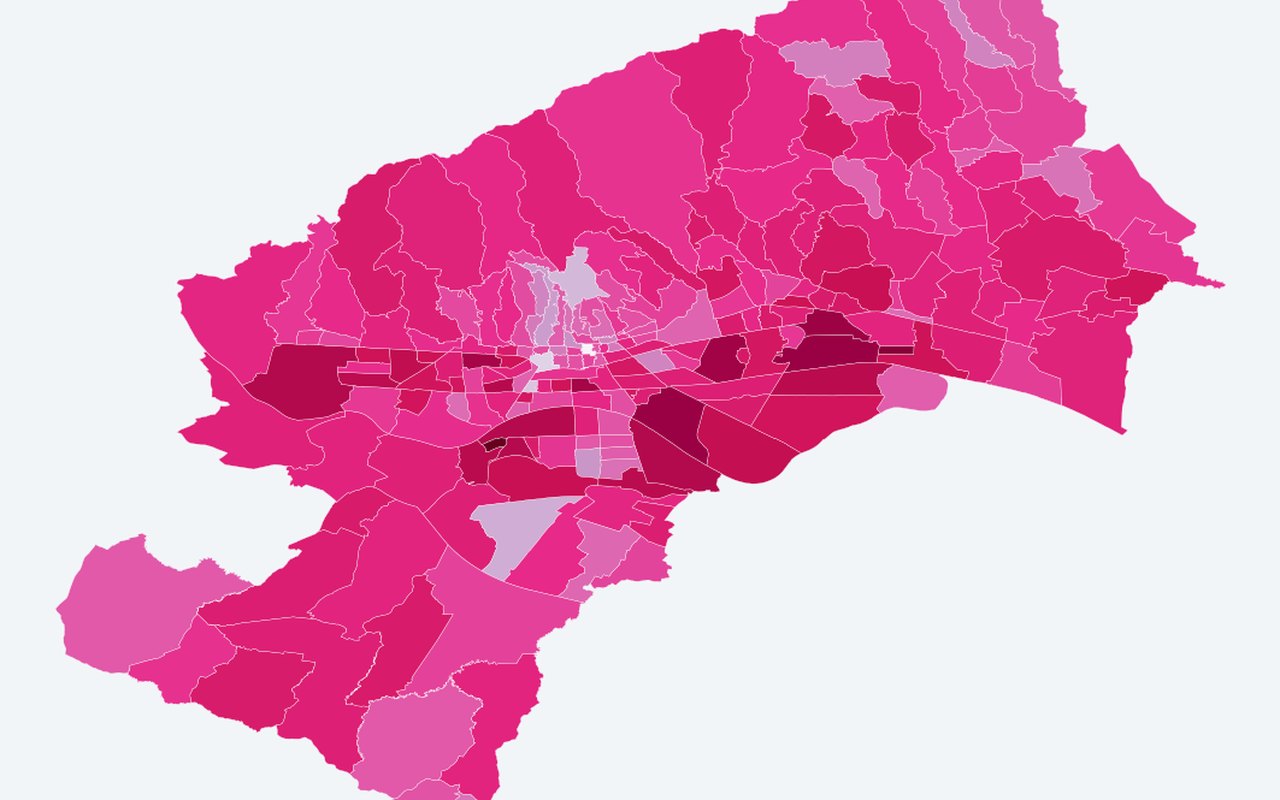
Thermal-risk intervention priority (Earth 2026)
Critical hotspot (high heat risk index + high β_DSI), climate hotspot, demographic-sensitive, or stable. Planning screen combining high heat risk index with demographic sensitivity.
Sensitive facilities
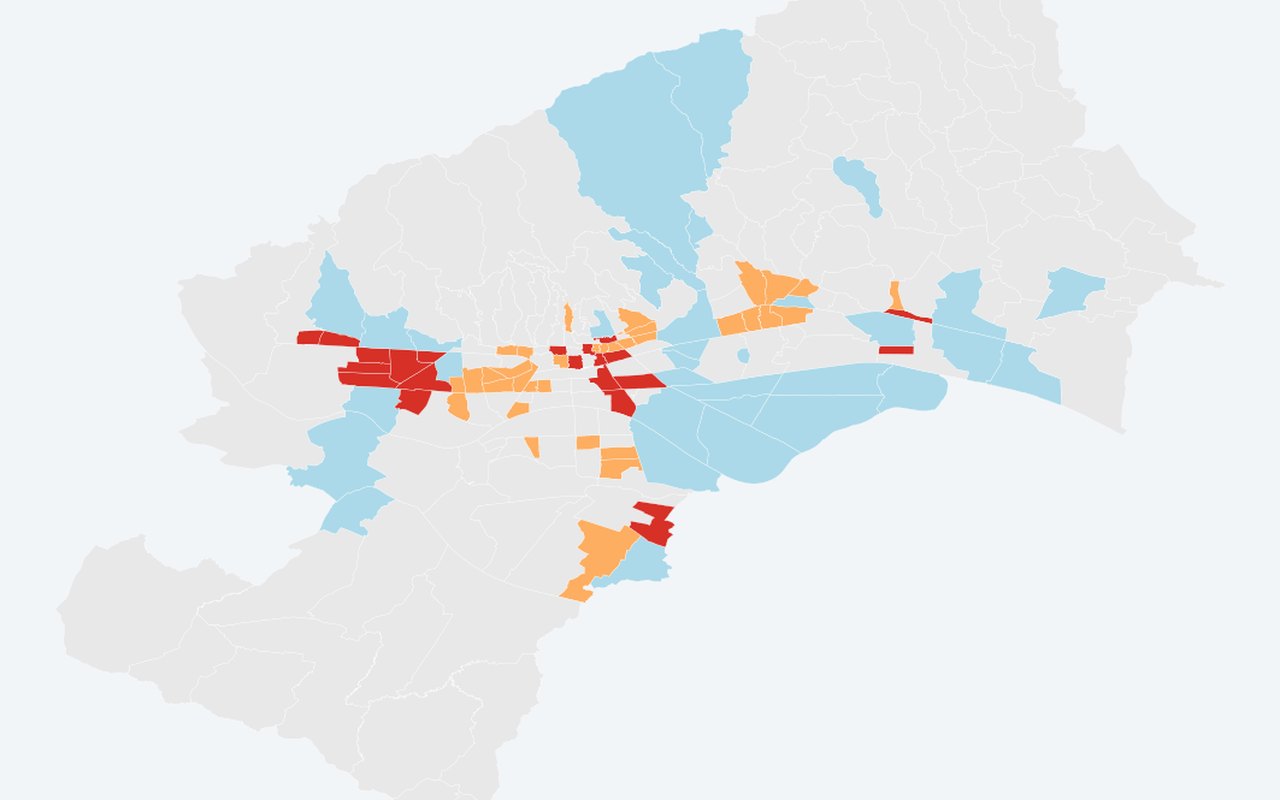
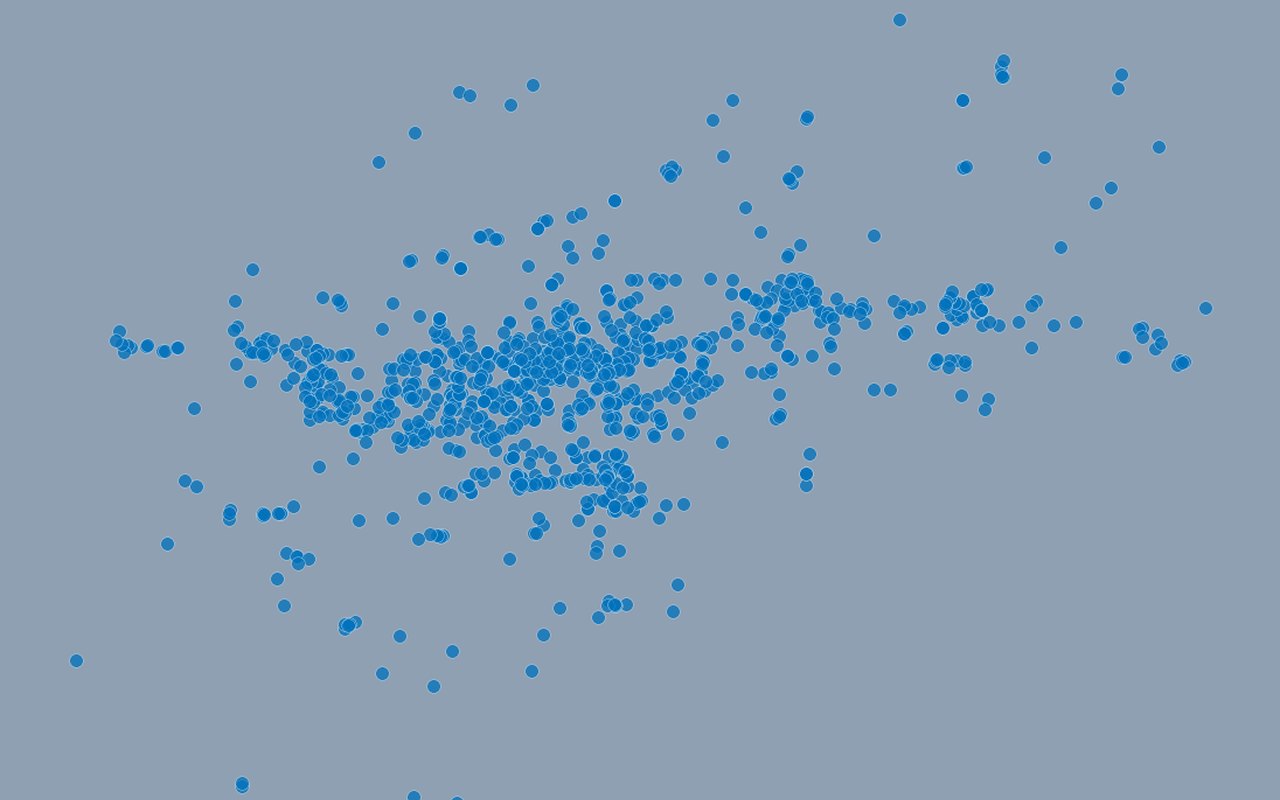
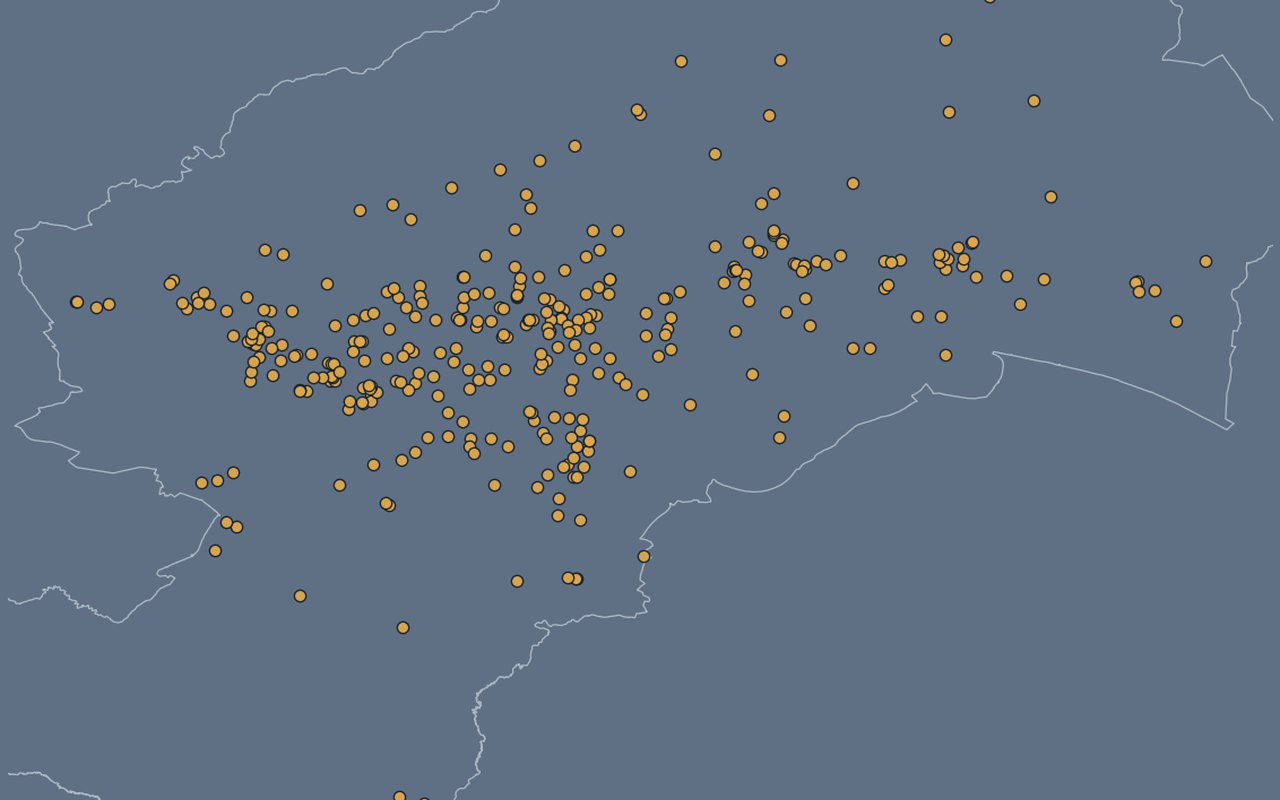
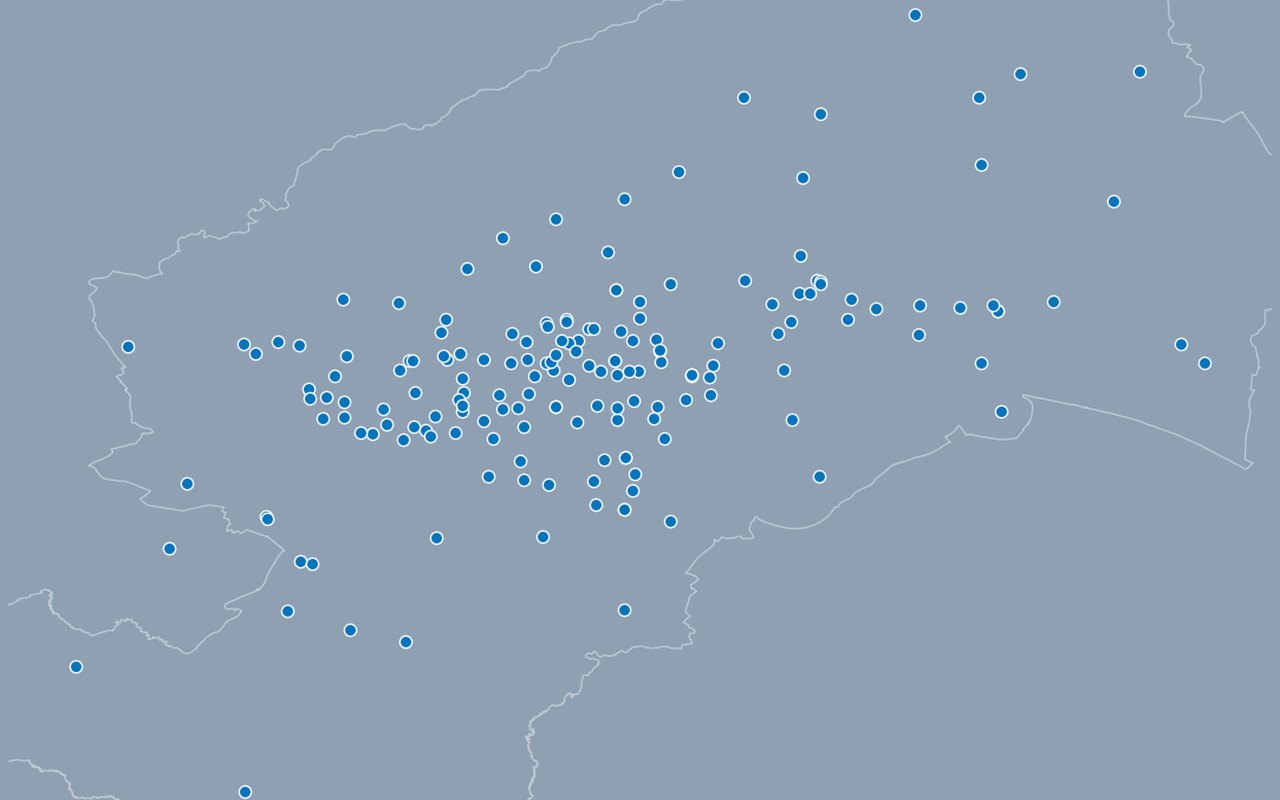
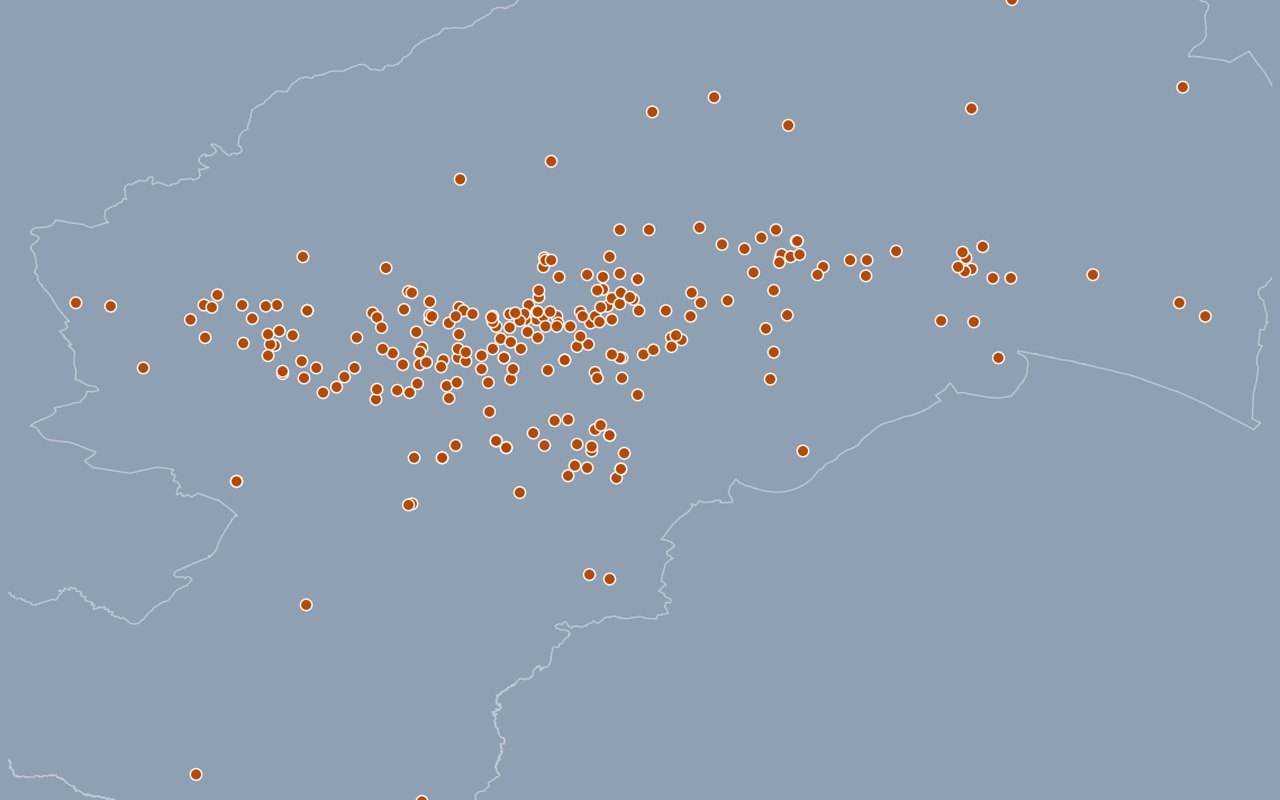
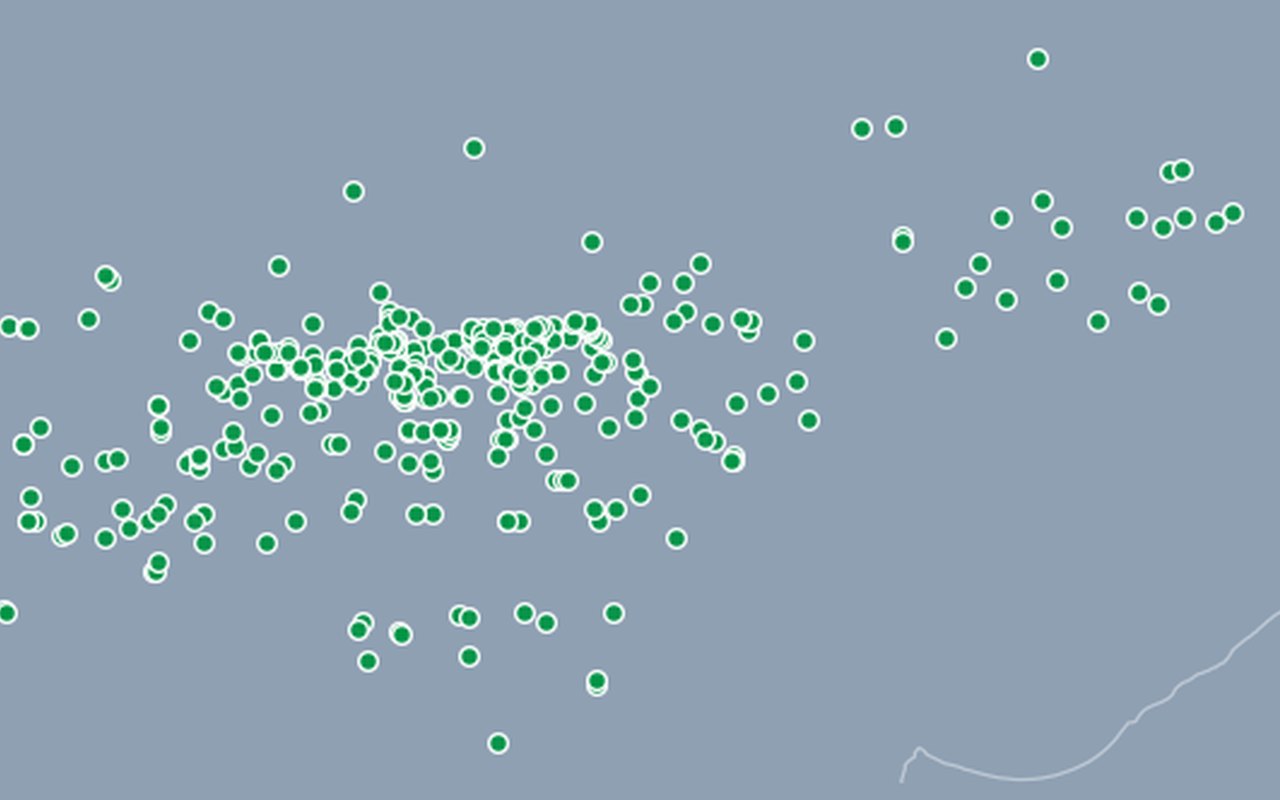
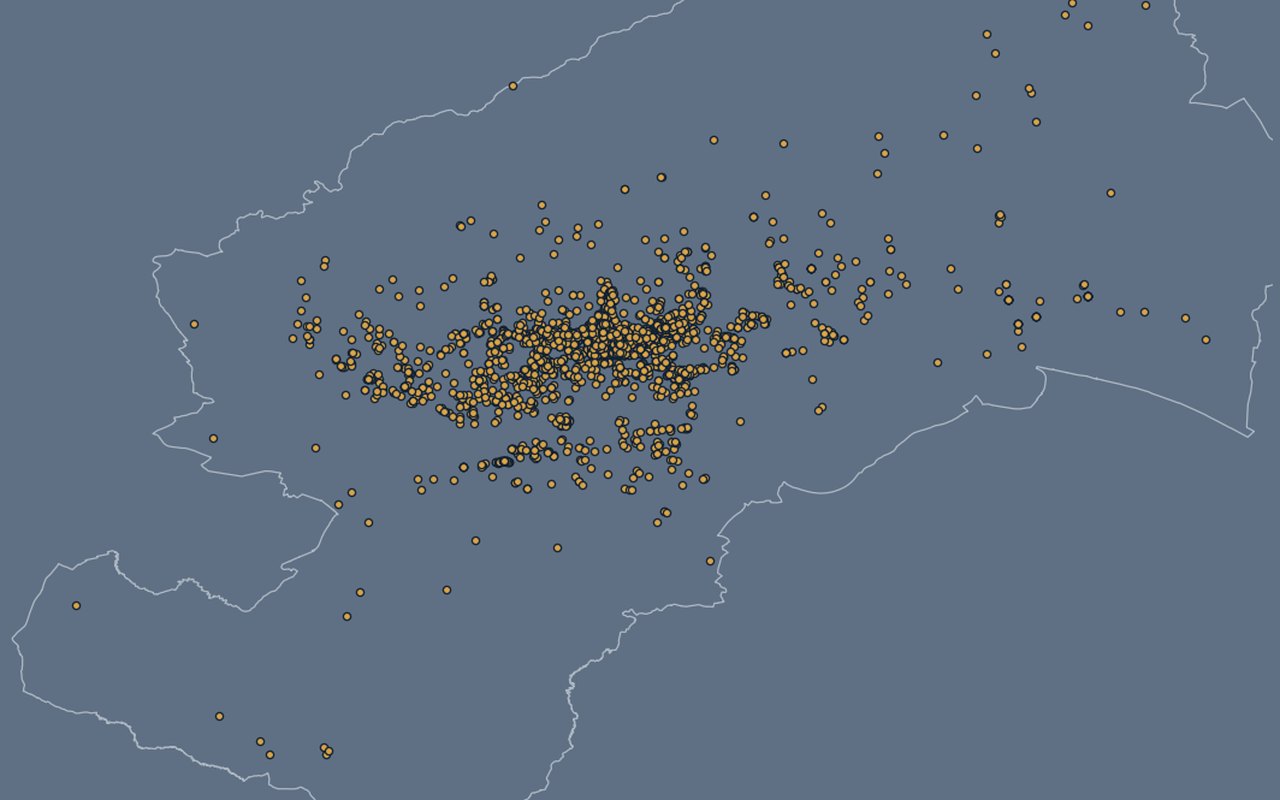
Point locations of sensitive facilities, often filtered or highlighted in the 32 hot+dense neighbourhoods. Schools, kindergartens, healthcare and sport sites.
City amenities
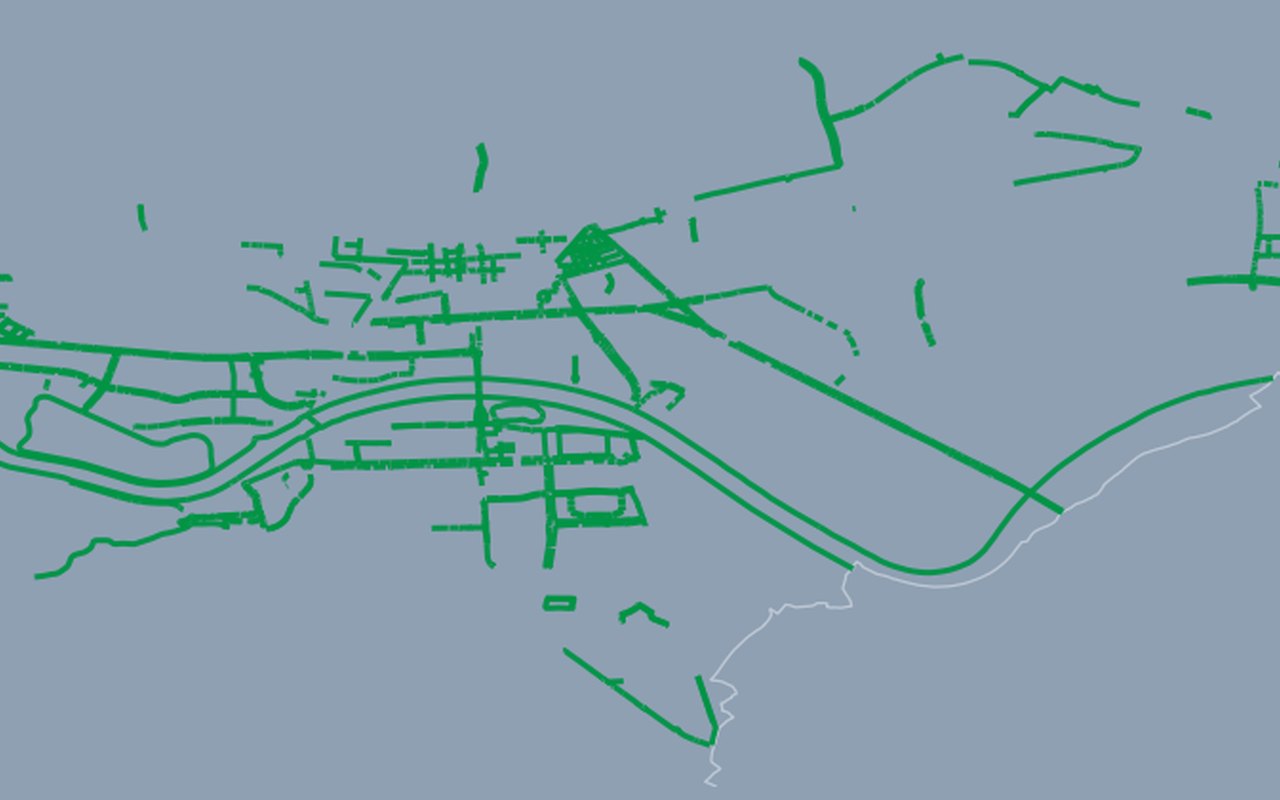
15Bicycle Paths
Mapped bicycle/pedestrian route segments from the official city mobility dataset. Official bicycle path network.
Bus Stations / Stops
Bus stop locations with line and accessibility attributes. Public bus stops.
Tram Stations
Tram stop locations with line and accessibility attributes. Tram stops.
Kindergartens
Registered kindergarten (dječji vrtić) locations across Zagreb. Kindergarten locations.
Elementary Schools
Public elementary (osnovna škola) locations across Zagreb. Elementary school locations.
High Schools
All public high-school locations in Zagreb (gymnasium, vocational, arts, private, special-needs) as points. High school locations.
Healthcare Providers
Point locations of registered providers with contact/address attributes where available. Healthcare provider locations.
City Outdoor Markets
Point locations of city markets with contact/opening attributes when provided. Outdoor market locations.
Public Spaces for Dogs
Designated public dog-space locations. Dog parks / public dog spaces.
Sport Fields
Public sport-field point locations. Sport field locations.
Sport Facilities
Sports-facility point locations with category/operator attributes. Sport facility locations.
Student Accommodation
Student accommodation point locations. Student housing locations.
Water Drinking Fountains
Public drinking-fountain point locations. Public drinking fountains.
Public Bike Parking
Public bike-parking stand locations with capacity attributes where available. Public bicycle parking stands.
Tourism Accommodation
Tourism accommodation point locations and type metadata. Tourism accommodation locations.



Greenery
6Tree cover deficit
Shows where high heat-vulnerability neighbourhoods still lack tree canopy relative to a realistic greening target, and where planting could cool the most.
NDVI greening trend
District polygons coloured by Sentinel-2 vegetation greenness slope (per year). Positive = greening. Sentinel-2 vegetation greenness slope per year by district.
Cool refuge access
neighbourhood centroids or points coloured by walk minutes to the nearest mapped green / cool space. Walk time to nearest cool refuge (RQ-D).
Green Areas (GUP zeleno + šuma)
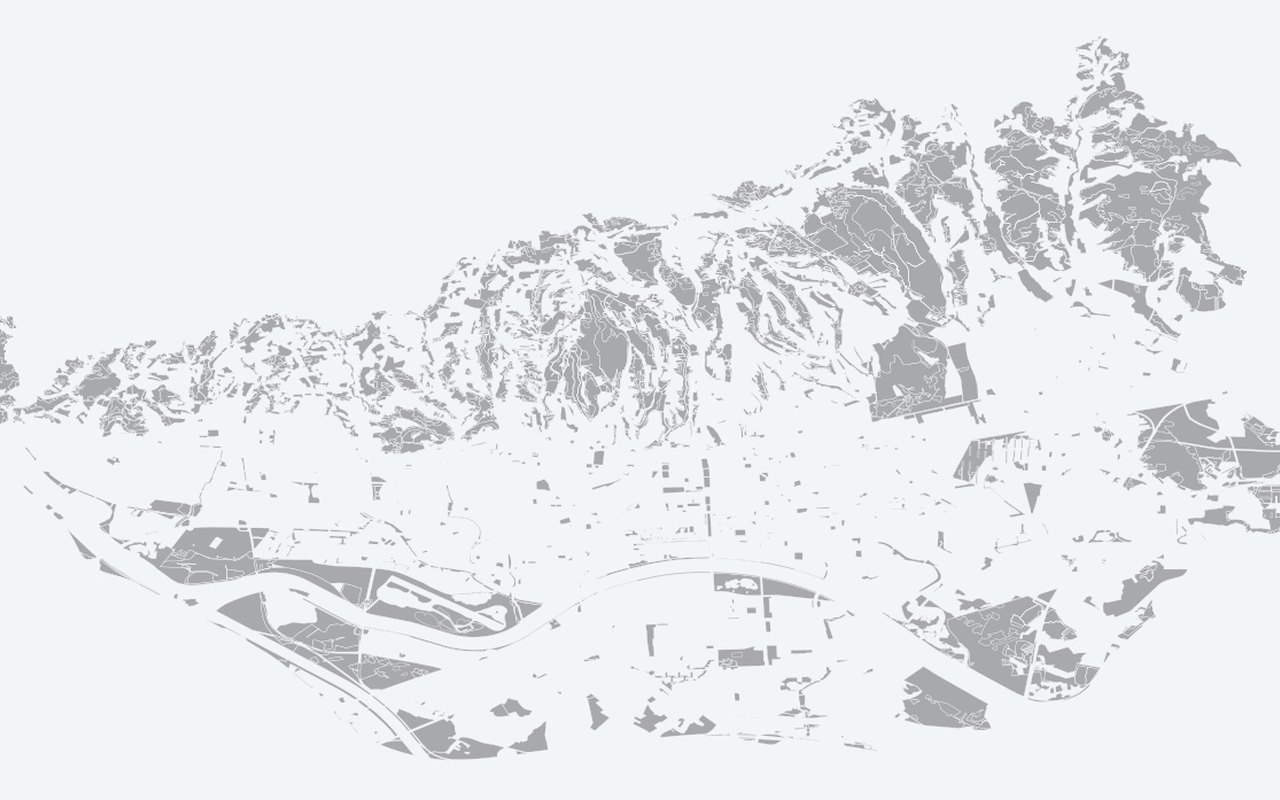
Polygons from the city's Generalni urbanistički plan (GUP). Official green / forest polygons from GUP.
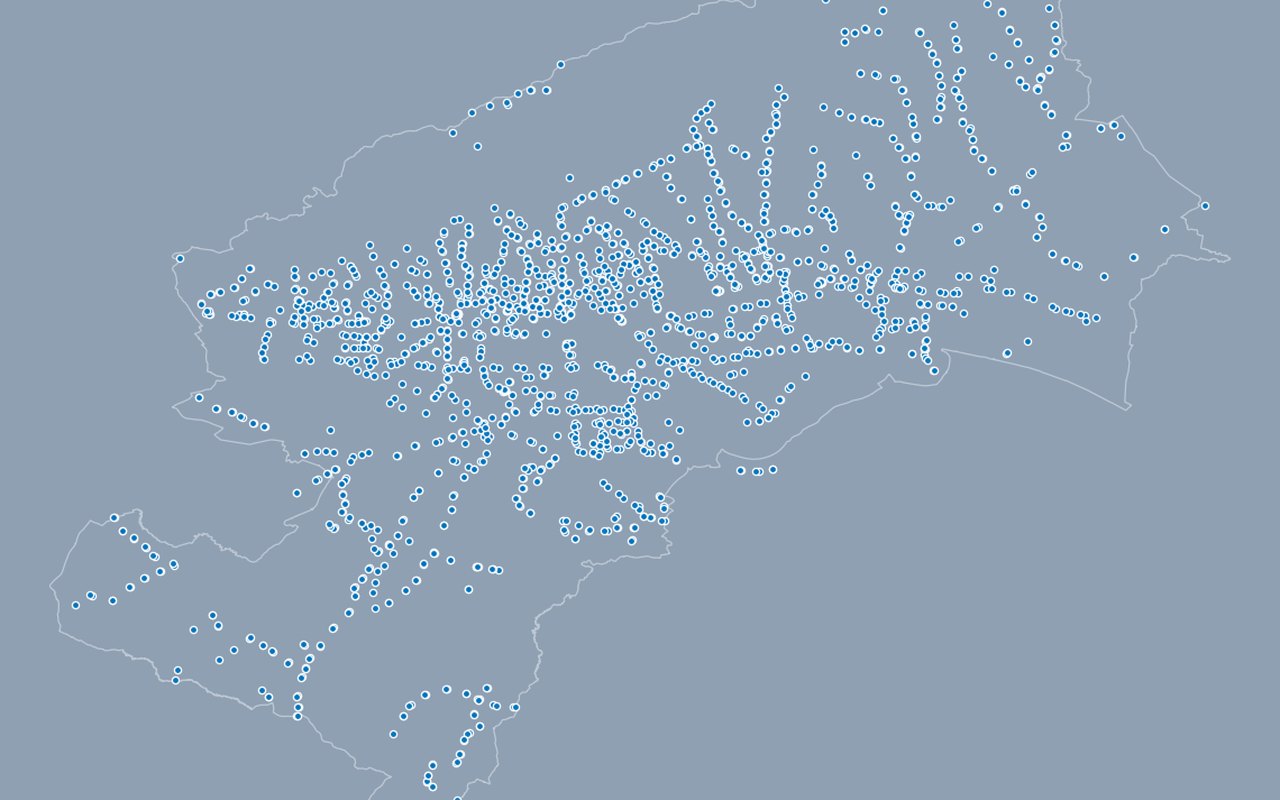
Green Cadastre (Trees)
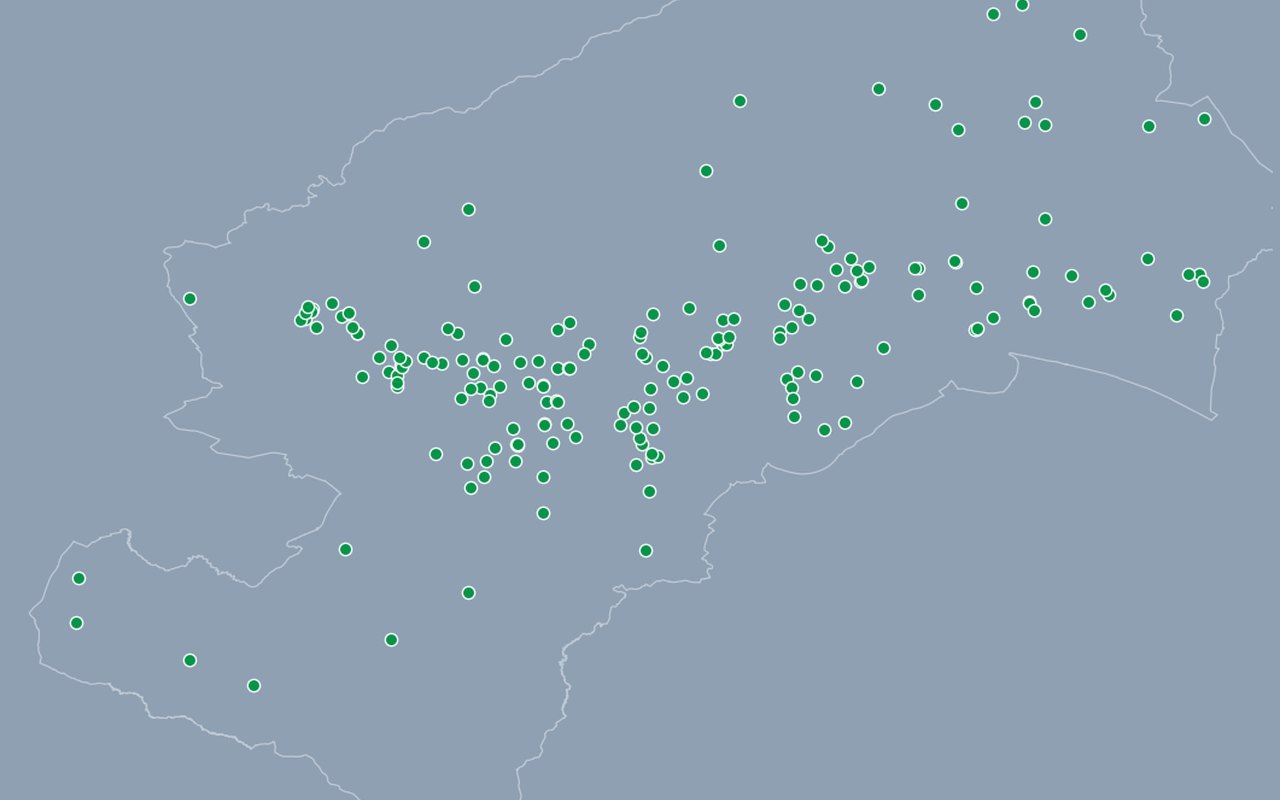
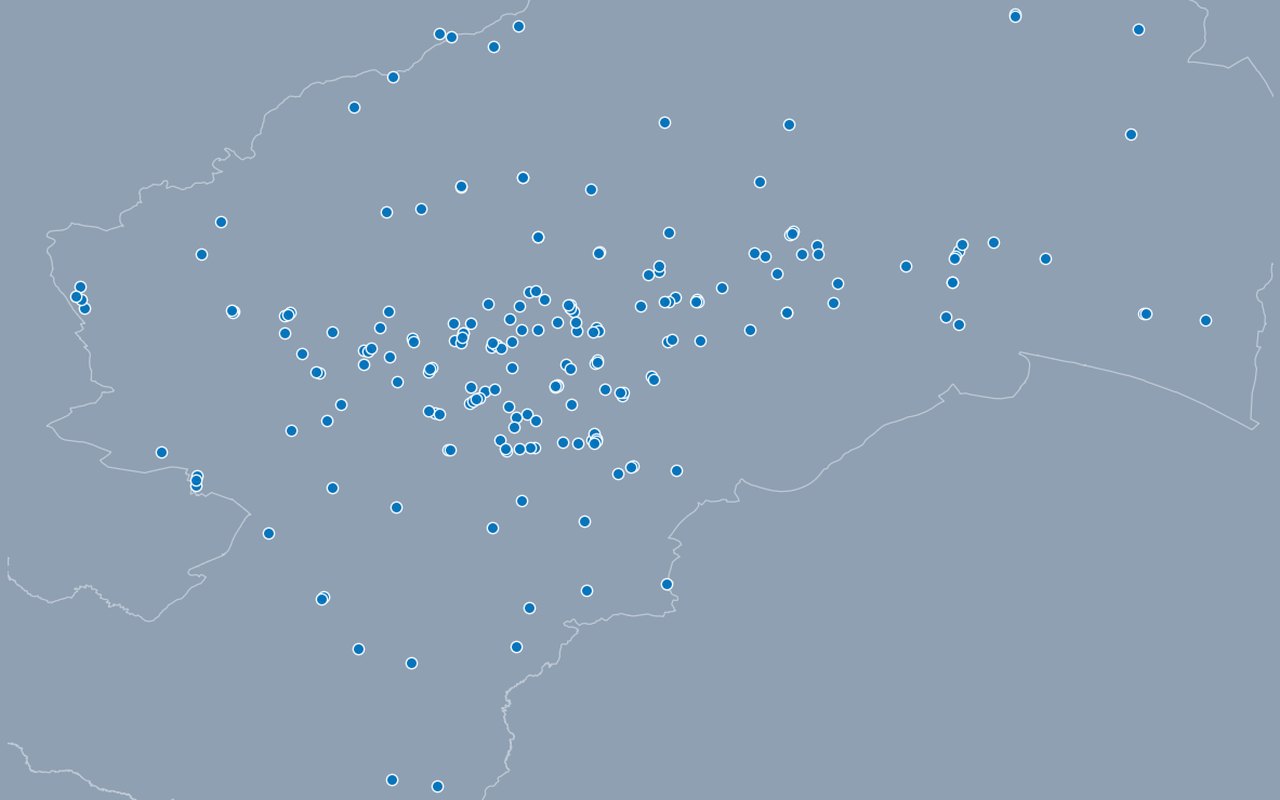
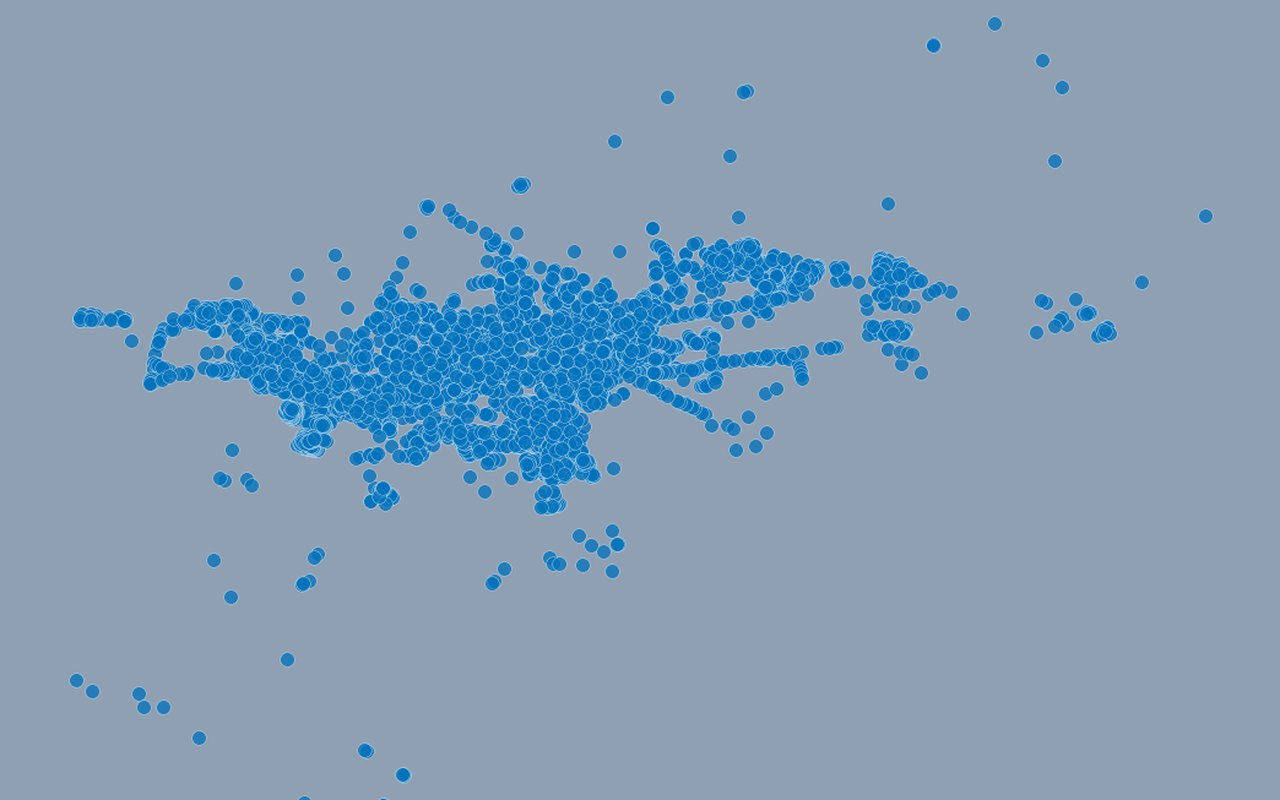
Individual trees from Zagreb’s official green cadastre. Zoom in to explore species and size cues such as height and crown.
Green Cadastre (Tree Density)
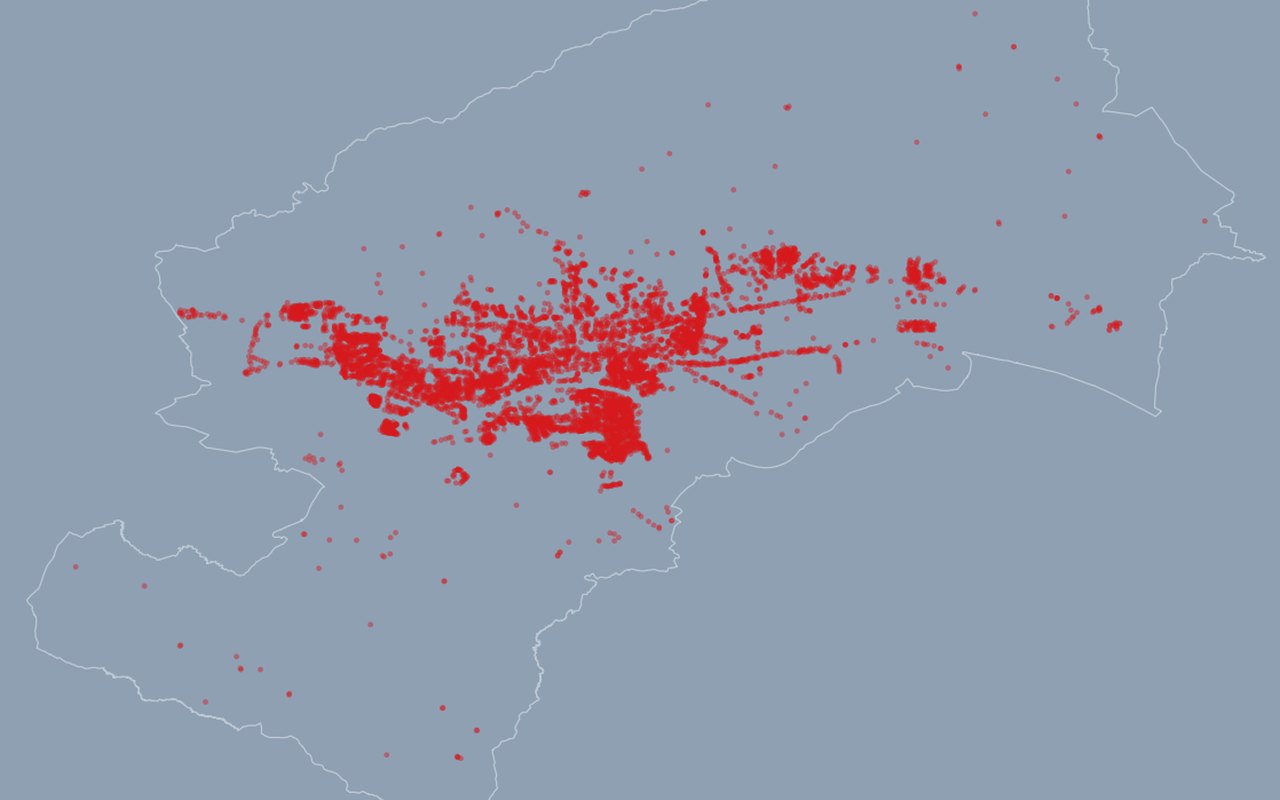
Heatmap of tree point density (same inventory as the clustered tree layer). Heatmap of tree density from the green cadastre (blurred intensity, not individual trees).
Reference
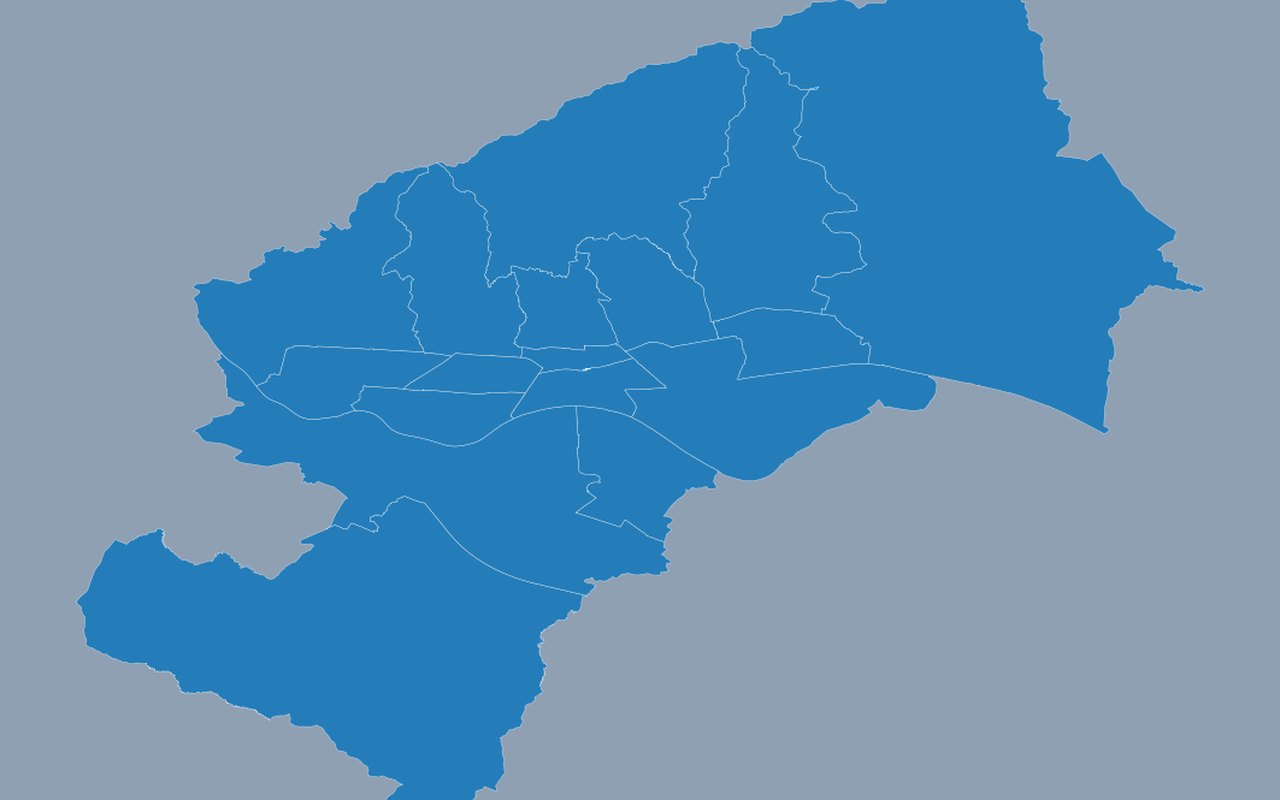
2City of Zagreb Boundary
Merged boundary of the same district polygons used elsewhere on the map. City administrative boundary.
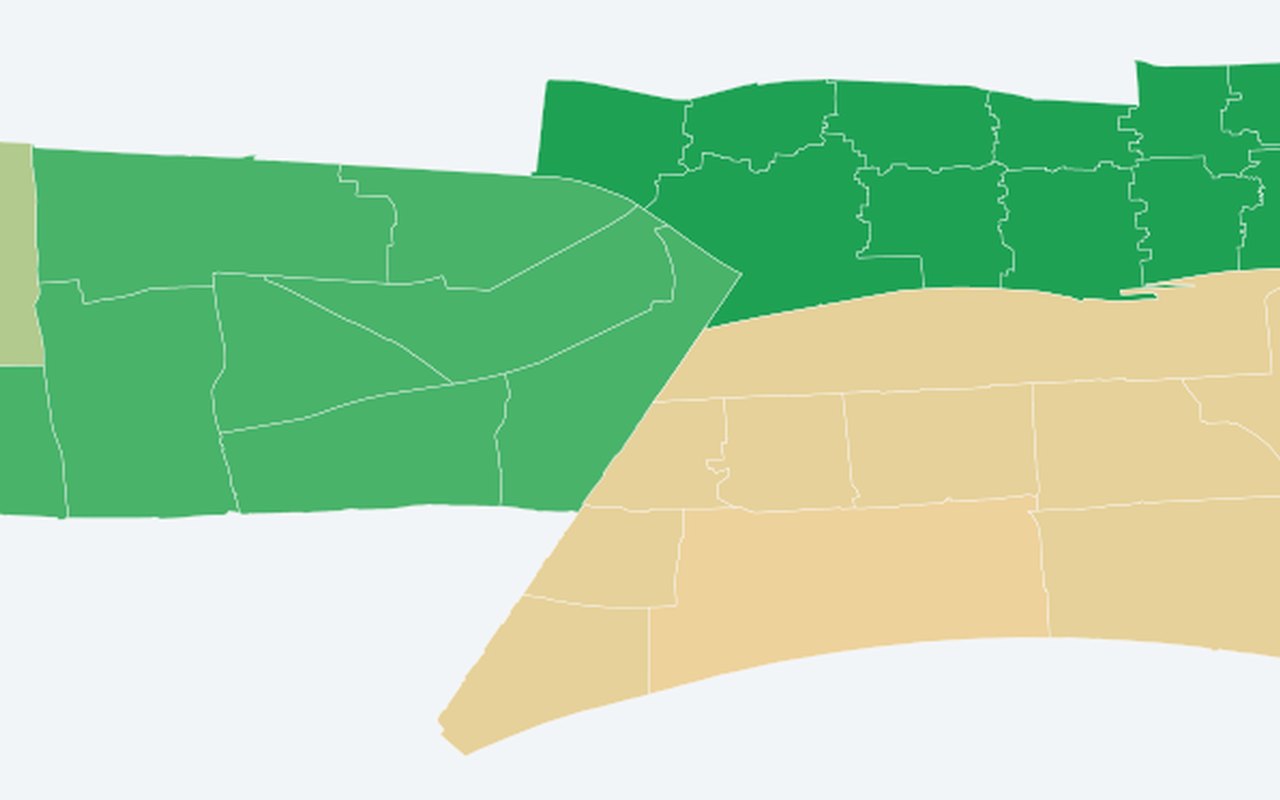
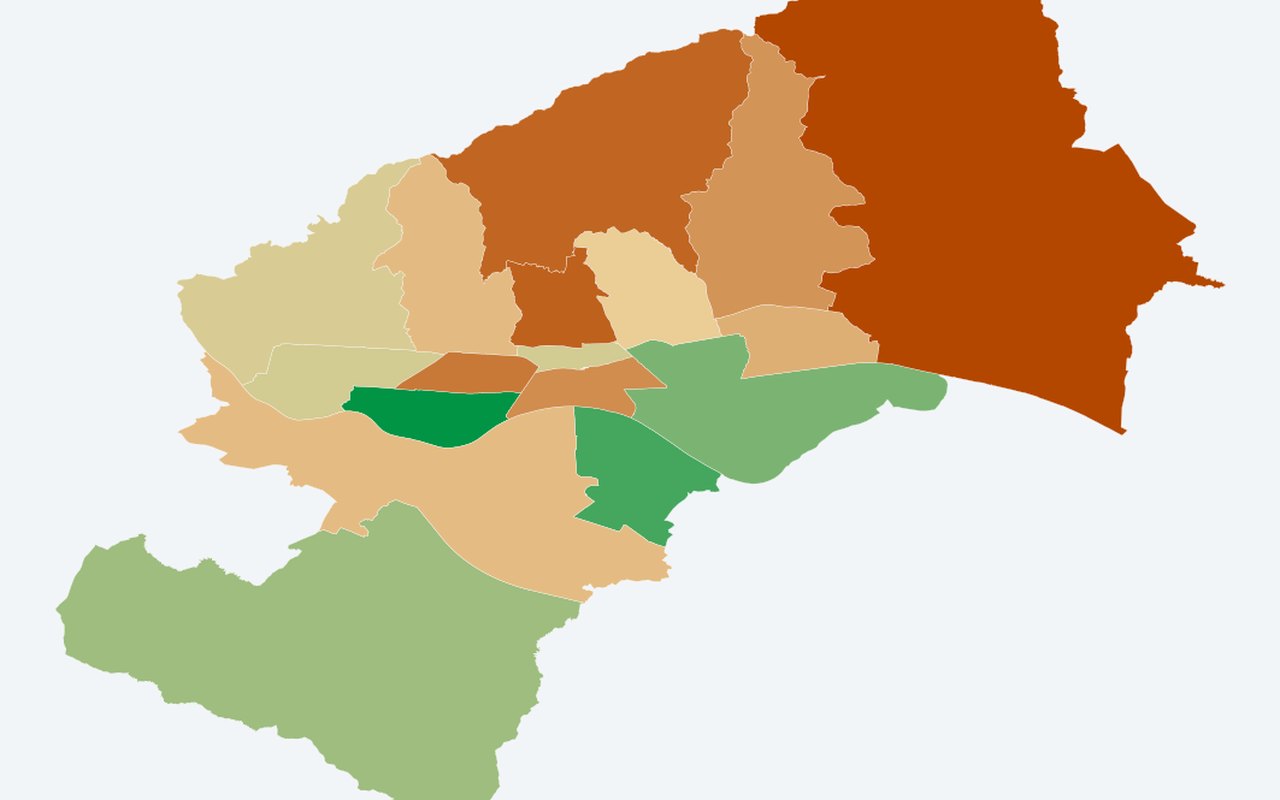
District Boundaries (Zagreb ArcGIS)
Zagreb's 17 city districts (gradske četvrti). Zagreb city district (gradska četvrt) boundaries.