
LST Z-Score (Anomaly)
Satellite rasters
Statistical anomaly map — how each pixel compares to the city-wide average temperature. Use this as a citywide satellite backdrop — helpful for seeing fine-grained patterns behind neighbourhood averages.
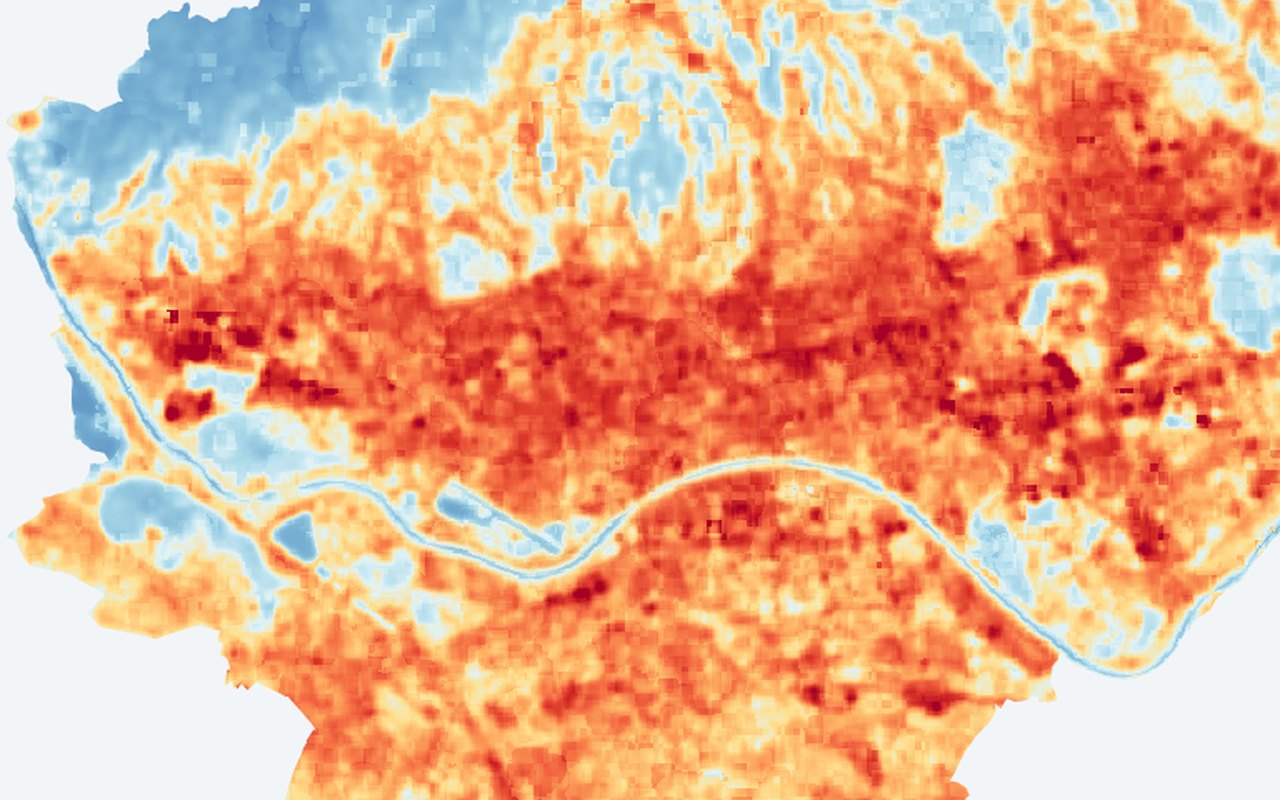
What it shows
Z = (pixel land surface temperature − city mean land surface temperature) / city std-dev. Blue (negative Z) = cooler than average; red (positive Z) = hotter than average. A pixel at 35 °C in a city averaging 38 °C appears blue (cool spot) even though 35 °C is hot in absolute terms. Useful for identifying local anomalies that absolute temperature maps miss — e.g. a warm pocket inside a park.
Data sources
Derived from the same Landsat/MODIS land surface temperature composite used for the primary analysis. Per-pixel Z-score with city-wide mean and std-dev computed via Google Earth Engine reduceRegion.
How it was prepared
Satellite scenes are filtered for cloud and quality issues, converted to the mapped indicator, and published as map tiles clipped to Zagreb.