
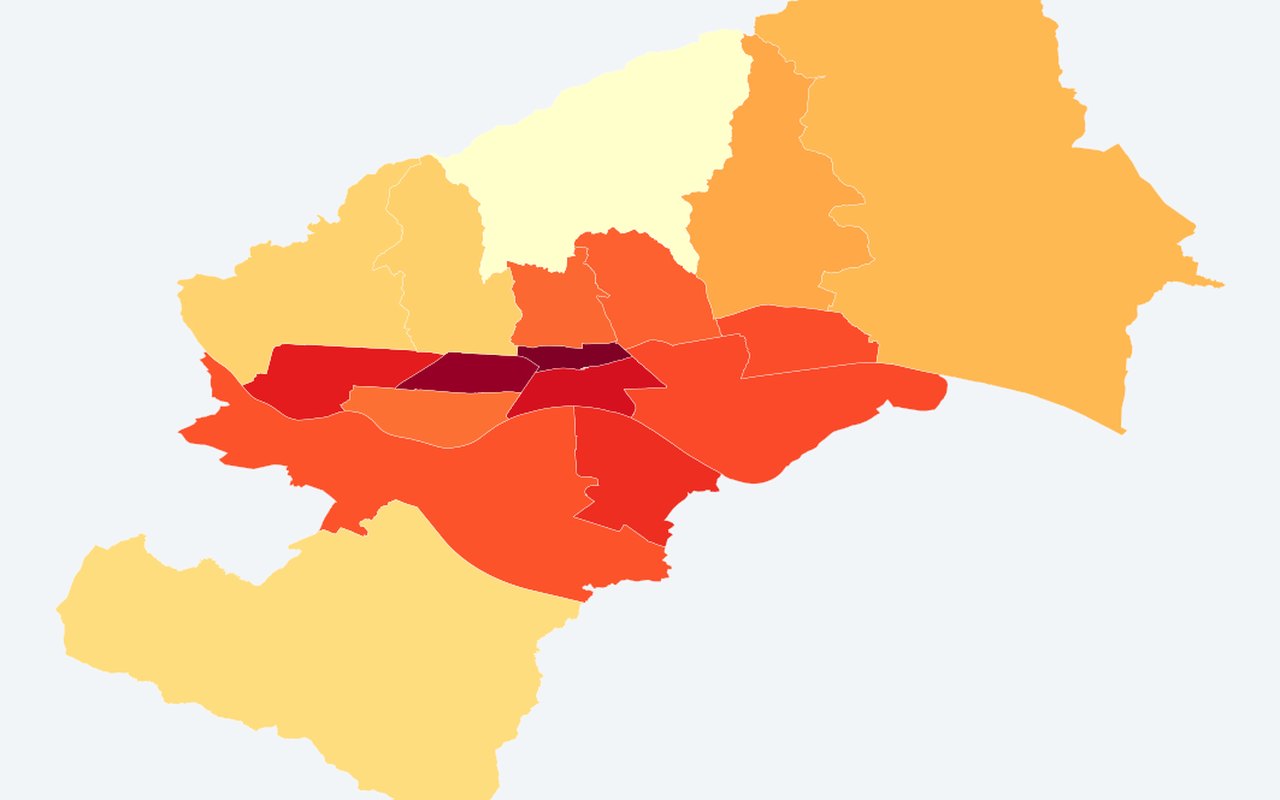
UHI Anomaly per Neighborhood (ΔT °C)
Findings
Per-district urban-vs-rural temperature difference. Use this when prioritising places for cooling, greening, or follow-up study.
What it shows
Mean land surface temperature minus a rural reference (WorldCover non-urban classes). Positive = hotter than rural. District mean land surface temperature minus rural reference.
Data sources
Google Earth Engine land surface temperature (Landsat 8/9 ST_B10 by default, MODIS MOD11A2 if you pass --source MODIS) with ESA WorldCover (Google Earth Engine) and neighbourhood polygons from Zagreb ArcGIS Gradske_cetvrti when available, otherwise OpenStreetMap admin boundaries via Overpass (often reused from ).
How it was prepared
Indicators are calculated from the project’s Zagreb heat, greenery, and population analyses, then drawn on planning-relevant units (neighbourhoods, districts, or parcels).