
NDVI greening trend
Greenery
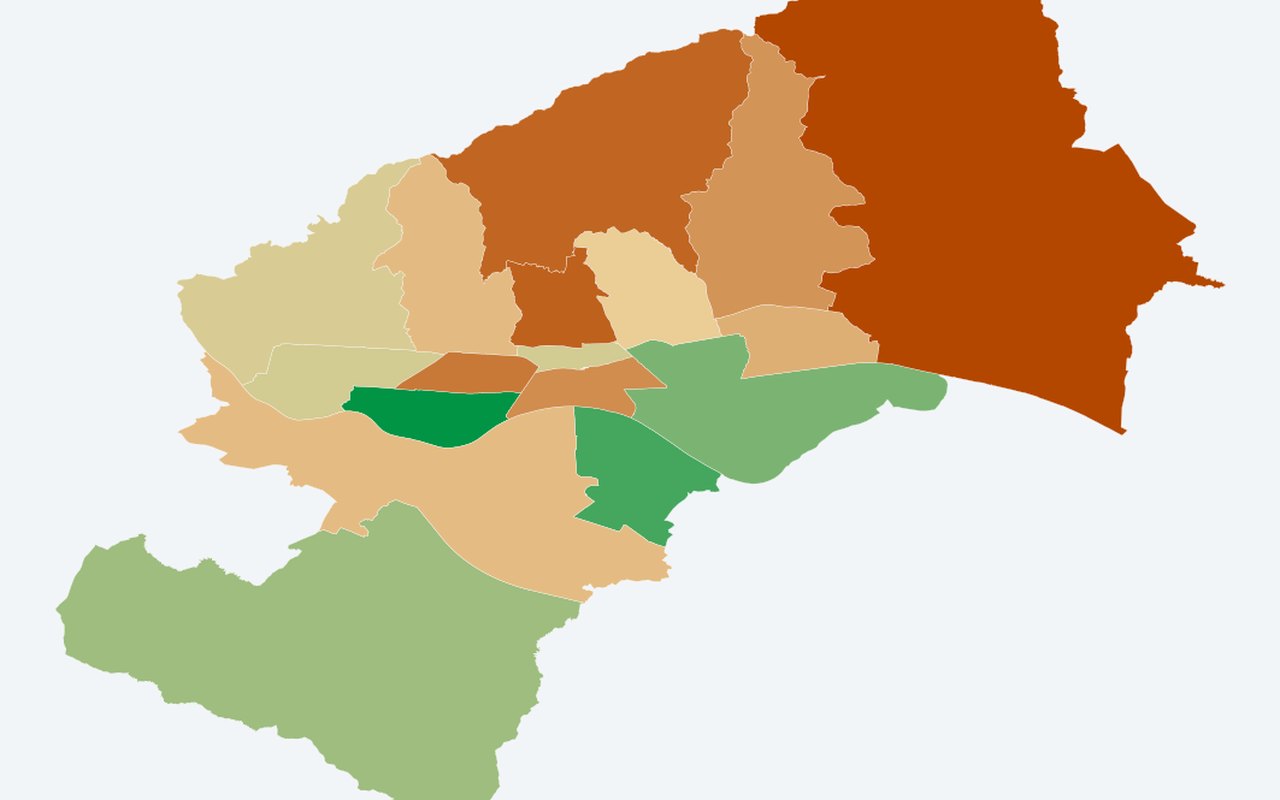
Multi-year vegetation change by district (RQ-E). Use this when planning planting, shade, or access to cool outdoor spaces.
What it shows
District polygons coloured by Sentinel-2 vegetation greenness slope (per year). Positive = greening. Sentinel-2 vegetation greenness slope per year by district.
Data sources
Summer Sentinel-2 vegetation greenness (2017–2025) and Landsat land surface temperature context from rqe_multiyear_trend outputs.
How it was prepared
Values are calculated for Zagreb using satellite, weather, census, and/or city open data, then drawn on the map units shown in the dashboard.