
Elderly heat exposure score — MO
Vulnerability & census
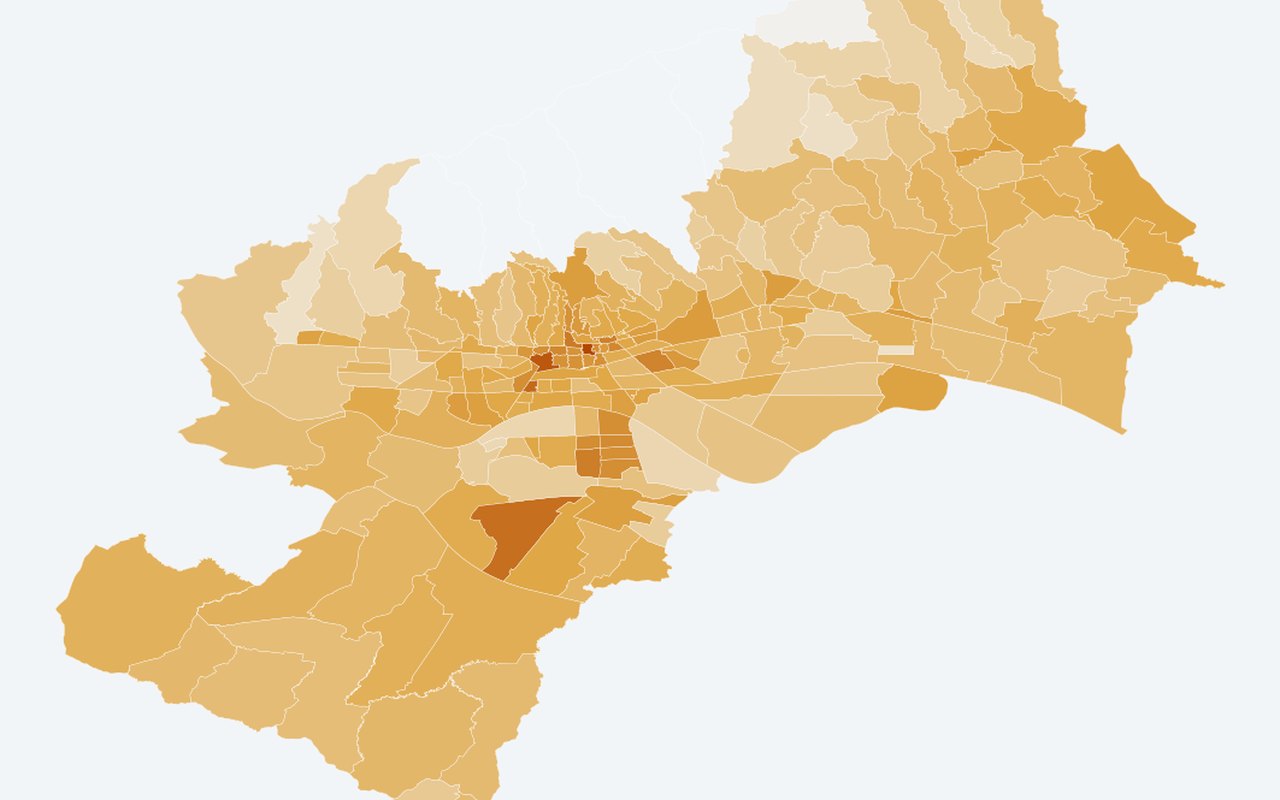
Combined vulnerability index: where elderly share overlaps warmer summer daytime air (ranking). Use this to see who lives in hotter areas and where social sensitivity is highest.
What it shows
0–1 score: elderly_share × robust_norm(estimated_air_temp_2m_C). Spatial detail comes from **census**, not ERA5-Land air.
Data sources
DZS Census 2021 T1 (65+) + Open-Meteo daytime air ranks. See for Grič/Maksimir/Pleso commute & night temps.
How it was prepared
Census and related demographic tables are joined to official neighbourhood polygons so heat and people can be read together on one map.