
Sentinel-2 NDBI (10 m)
Satellite rasters
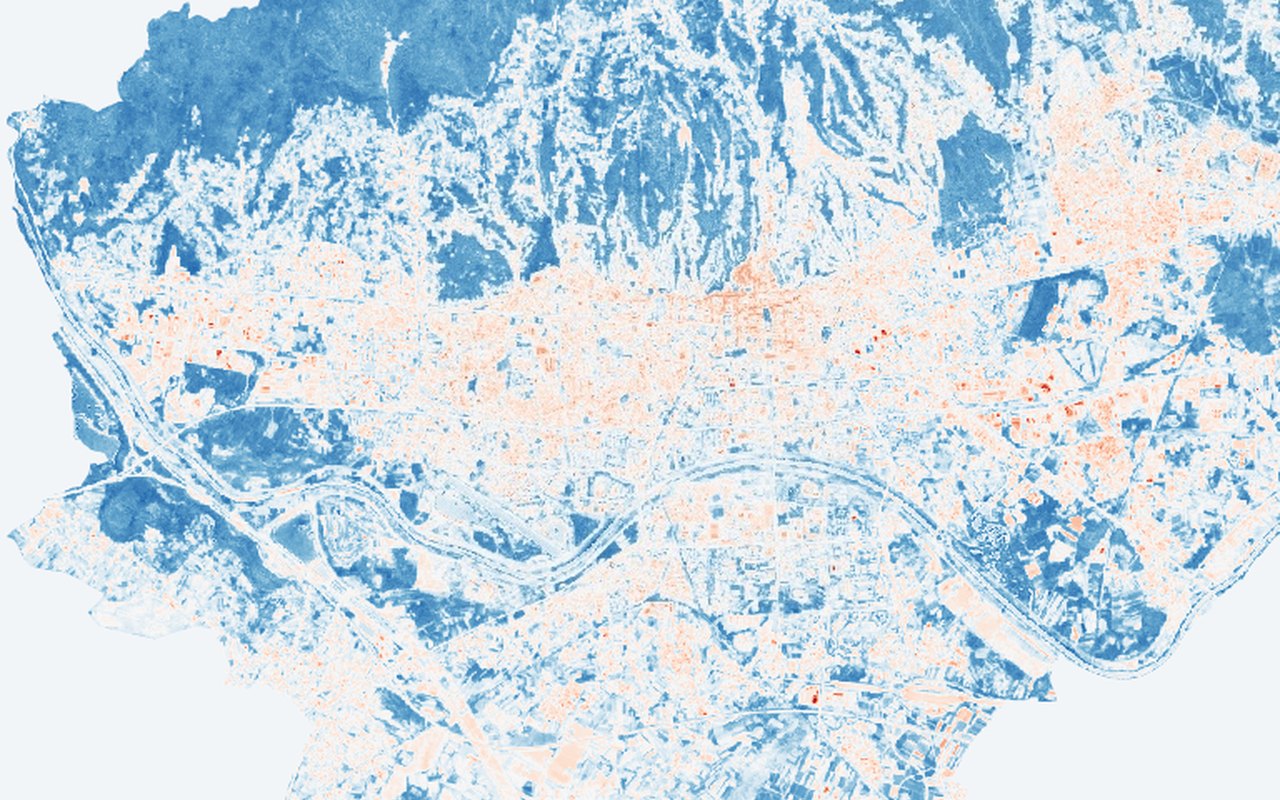
Built-up density index at 10 m — reveals impervious surface patterns at block scale. Use this as a citywide satellite backdrop — helpful for seeing fine-grained patterns behind neighbourhood averages.
What it shows
Normalized Difference Built-up Index. Red (built-up intensity > 0.1) = dense built-up or bare soil. Blue (built-up intensity < −0.2) = vegetation or water. Higher built-up intensity correlates with higher land surface temperature — use this to identify heat-driving surfaces.
Data sources
Sentinel-2 L2A SWIR1 (B11) and NIR (B8) bands at 10–20 m, median composite, cloud-masked.
How it was prepared
Satellite scenes are filtered for cloud and quality issues, converted to the mapped indicator, and published as map tiles clipped to Zagreb.