
LST vs TAIR hot-spot overlap (Atmosphere 2026)
Baseline (citywide heat)
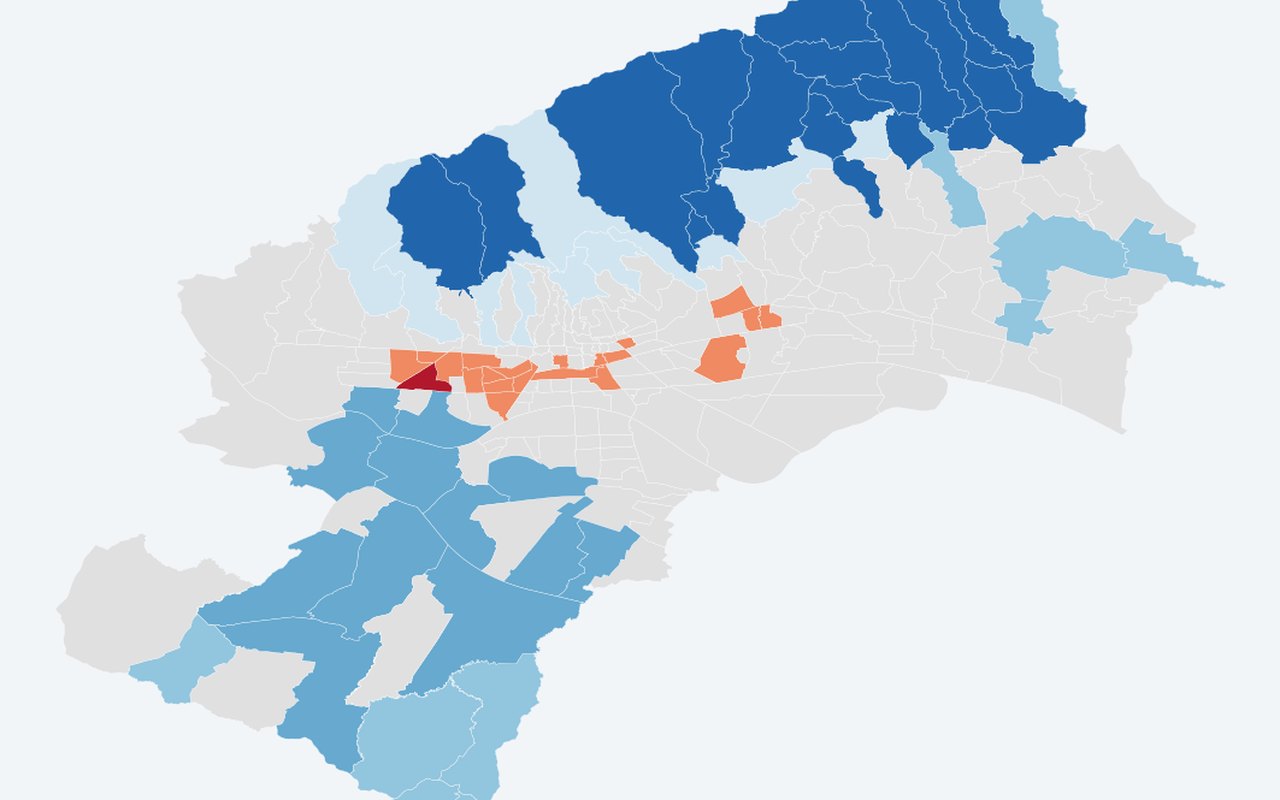
Convergent vs divergent surface and atmospheric thermal extremes. Use this when comparing how hot Zagreb feels across the city on a typical summer day or night.
This is surface temperature from satellite, not the air temperature measured by weather stations or felt by pedestrians.
What it shows
Getis–Ord Gi* cross-tabulation: both hot/cold, land surface temperature-only, air temperature-only, or not significant (α=0.05).
Data sources
Queen-contiguity Gi* on neighbourhood mean land surface temperature and air temperature (spatial neighbourhood statistics / local cluster statistics).
How it was prepared
Map adaptation of the cited study — same neighbourhood unit (218 neighbourhoods) and core methods, not a full replication. vegetation greenness/built-up intensity land-cover analysis (paper RQ3) is not shown on this map. Gi* logic matches §3.5.3; computed where both land surface temperature and air temperature exist for an neighbourhood. Class counts are qualitatively similar (e.g. one convergent hot neighbourhood) but not identical to published tables.
Interpretation limits
Surface temperature from satellites is not the same as the air temperature people feel at street level. Where this map adapts a published study, it follows the same planning units and core idea but is not a full paper replication.
Citation
Bečić, D.; Gašparović, M. (2026). Spatial Decoupling of Surface and Atmospheric Urban Heat: Differential Land Cover Associations in Zagreb. Atmosphere, 17, 466. DOI: 10.3390/atmos17050466