
LST Z-Score Classes (1-10)
Satellite rasters
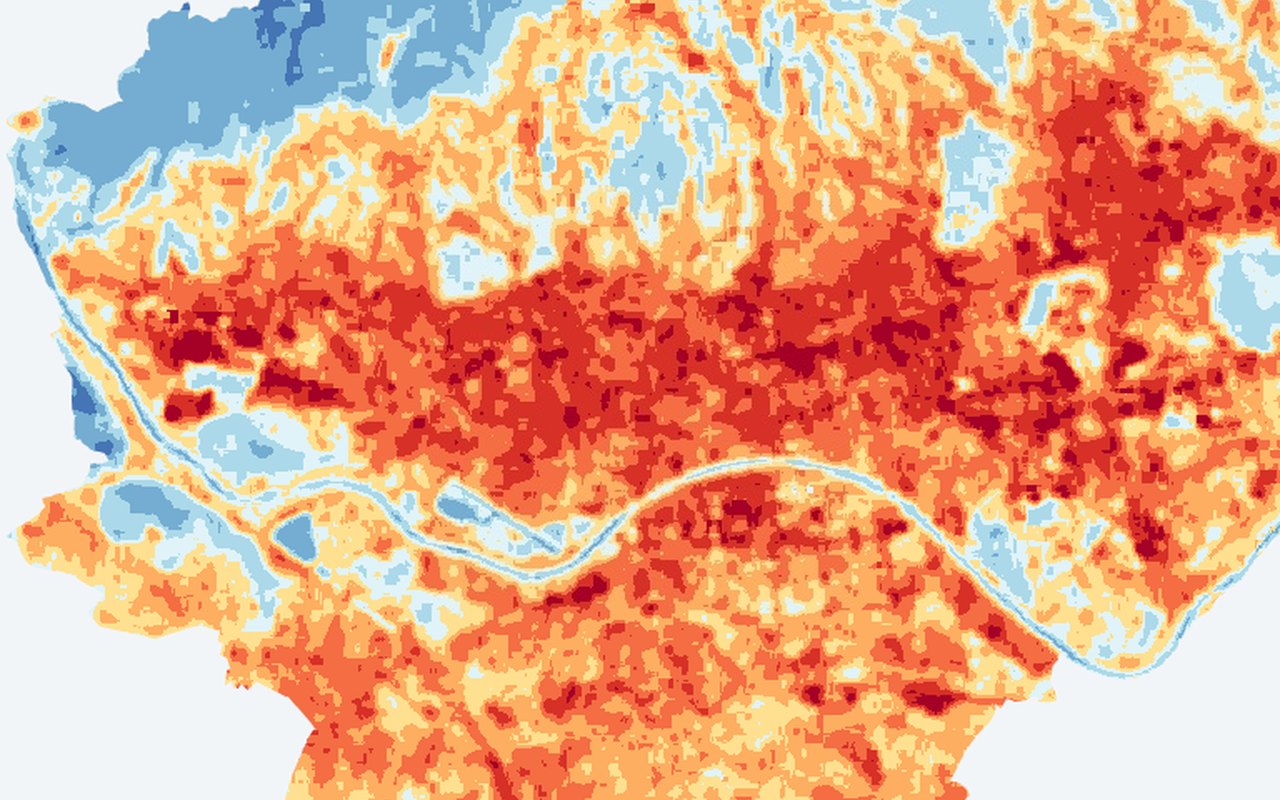
Classified version of land surface temperature Z-score for quick visual communication. Use this as a citywide satellite backdrop — helpful for seeing fine-grained patterns behind neighbourhood averages.
What it shows
10 fixed classes from extreme cold spot (class 1, Z ≤ −2.0) to extreme hot spot (class 10, Z > 2.0). Middle classes (5–6) are near-average. Class 1–4: progressively cooler than average. Class 7–10: progressively hotter than average. Simpler to interpret than continuous Z values — hand this to a policy maker and say 'red = act here'.
Data sources
Same Z-score image, binned into 10 classes at 0.5 σ intervals.
How it was prepared
Satellite scenes are filtered for cloud and quality issues, converted to the mapped indicator, and published as map tiles clipped to Zagreb.