
Sentinel-2 NDVI (10 m)
Satellite rasters
Ultra-high-resolution vegetation index — 3× finer than Landsat vegetation greenness. Use this as a citywide satellite backdrop — helpful for seeing fine-grained patterns behind neighbourhood averages.
What it shows
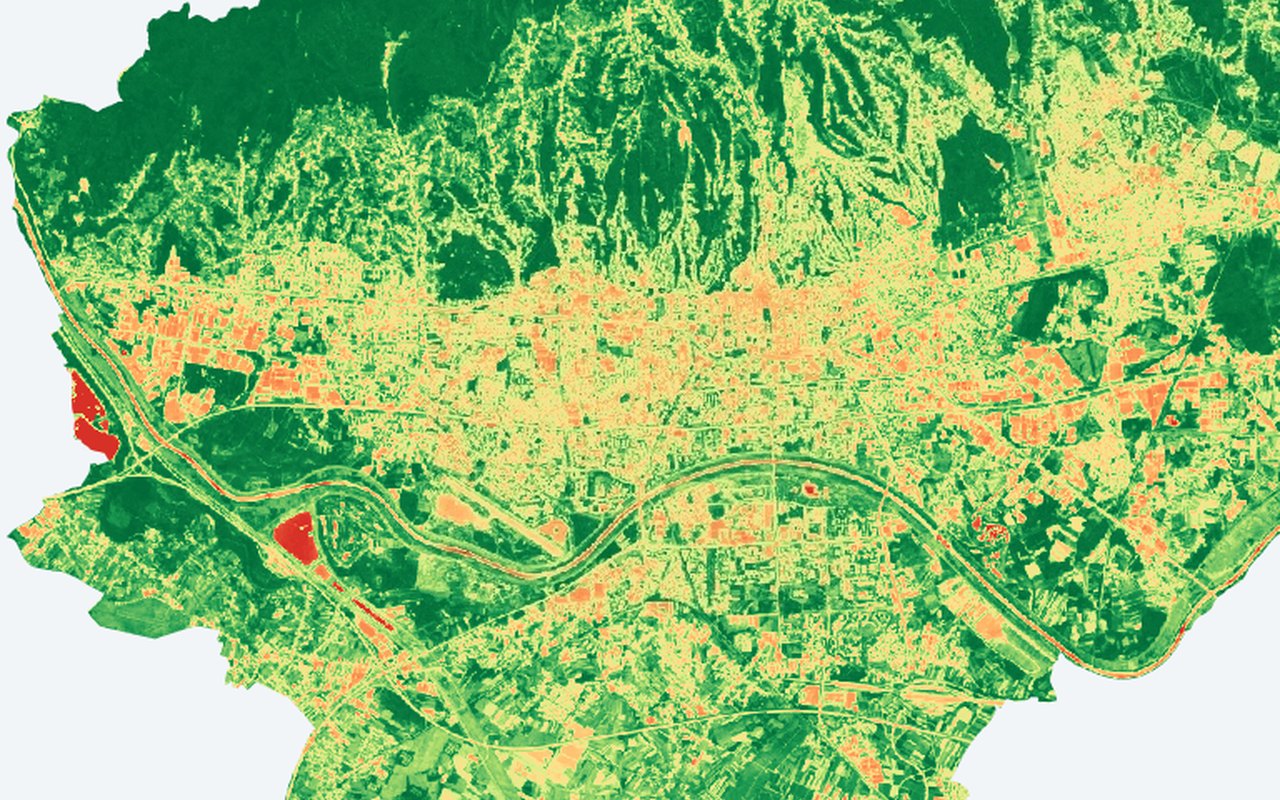
Normalized Difference Vegetation Index at 10 m from Sentinel-2 MSI. Dark green (vegetation greenness > 0.6) = dense healthy vegetation (parks, forests). Yellow (0.2–0.4) = sparse vegetation or irrigated turf. Red (< 0.1) = bare soil, asphalt, or water. Compare side-by-side with the 30 m Landsat vegetation greenness to see block-level detail that coarser imagery misses — individual tree canopies, courtyards, green roofs.
Data sources
Copernicus Sentinel-2 L2A (COPERNICUS/S2_SR_HARMONIZED), cloud-masked via SCL band, median composite over the analysis summer window.
How it was prepared
Satellite scenes are filtered for cloud and quality issues, converted to the mapped indicator, and published as map tiles clipped to Zagreb.