
Heat Risk Population Index (HRPI) — 2024 (Earth 2026)
Vulnerability & census
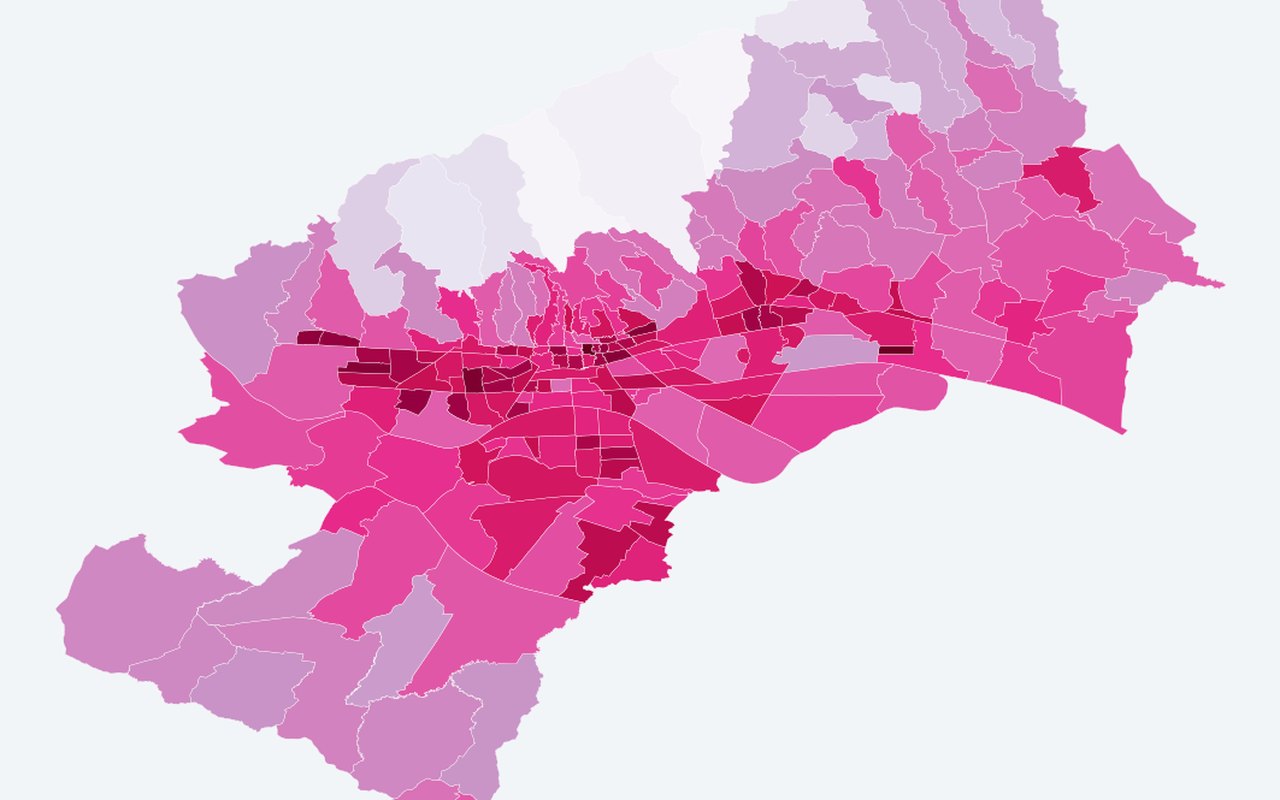
Highlights neighbourhoods where thermal load and sensitive populations overlap for summer 2024.
What it shows
A neighbourhood heat-risk score that blends summer air and surface temperature with demographic sensitivity and population density. Higher values mean more combined heat and people at risk.
Data sources
Census 2021 demographics (DZS), Landsat surface temperature, and reanalysis air temperature for July–August.
How it was prepared
Each input is scaled across neighbourhoods and averaged into one heat risk index, adapted from the Earth 2026 Zagreb study.
Interpretation limits
A planning screen for neighbourhoods — not a prediction of individual health outcomes.
Citation
Bečić, D.; Gašparović, M. (2026). Disentangling Climate and Demographic Drivers of Urban Heat Risk: A Geographically Weighted Regression Analysis of Zagreb (2001–2024). Earth, 7, 72. DOI: 10.3390/earth7030072