
LISA Clusters (HH/LL/HL/LH)
Findings
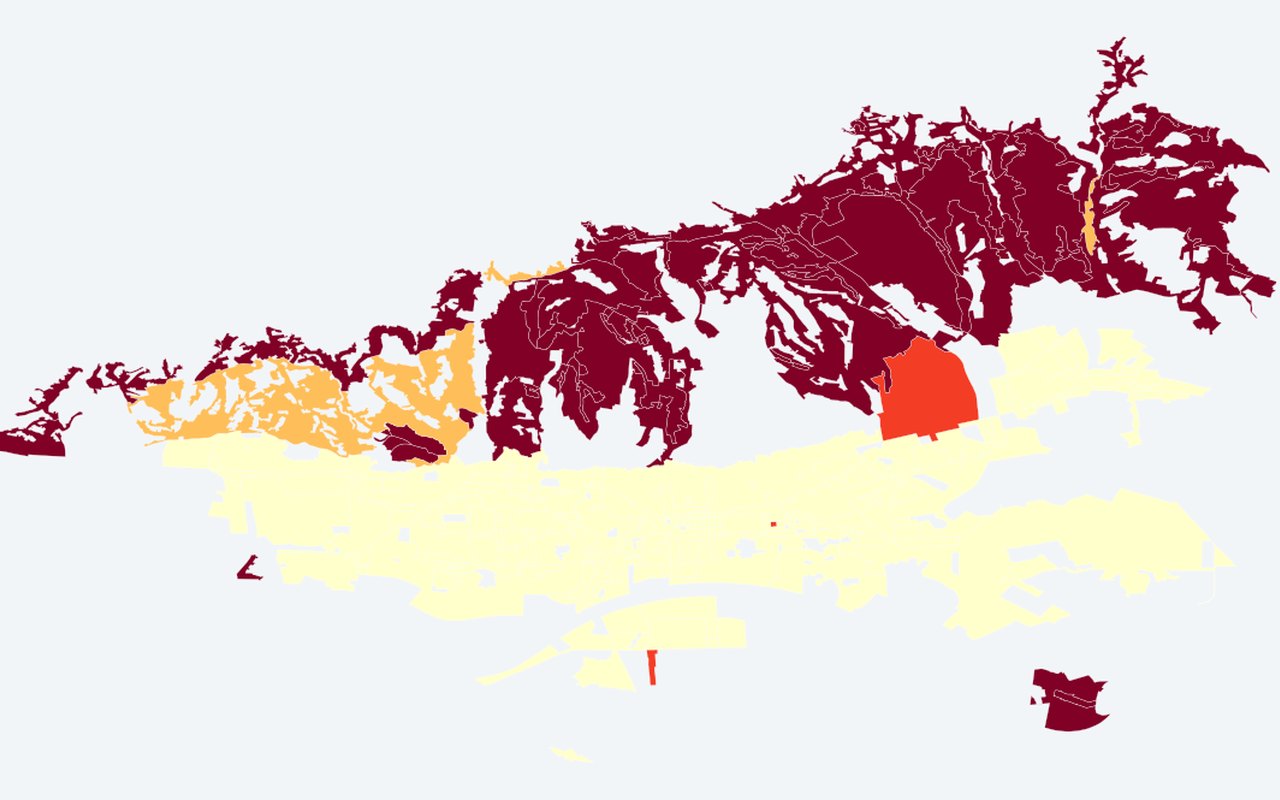
Statistical spatial-cluster result (Local Moran's I), not a raw heat map. Use this when prioritising places for cooling, greening, or follow-up study.
What it shows
HH = heat cluster, LL = cool cluster, HL/LH = outliers. Grey = not significant at p < 0.05. Local Moran's I heat clusters.
Data sources
Composite UHI values on those same GUP polygons, with Queen contiguity (spatial neighbourhood statistics) and local cluster statistics (999 permutations) run locally on exported attributes.
How it was prepared
Indicators are calculated from the project’s Zagreb heat, greenery, and population analyses, then drawn on planning-relevant units (neighbourhoods, districts, or parcels).
Interpretation limits
Statistical spatial-cluster result (Local Moran's I), not a raw heat map.
Citation
Bečić, D.; Gašparović, M. (2025). Urban Heat Islands and Land-Use Patterns in Zagreb: A Composite Analysis Using Remote Sensing and Spatial Statistics. Land, 14(7), 1470. DOI: 10.3390/land14071470