
Green Cadastre (Tree Density)
Greenery
Where tree canopy cover is concentrated at street scale. Use this when planning planting, shade, or access to cool outdoor spaces.
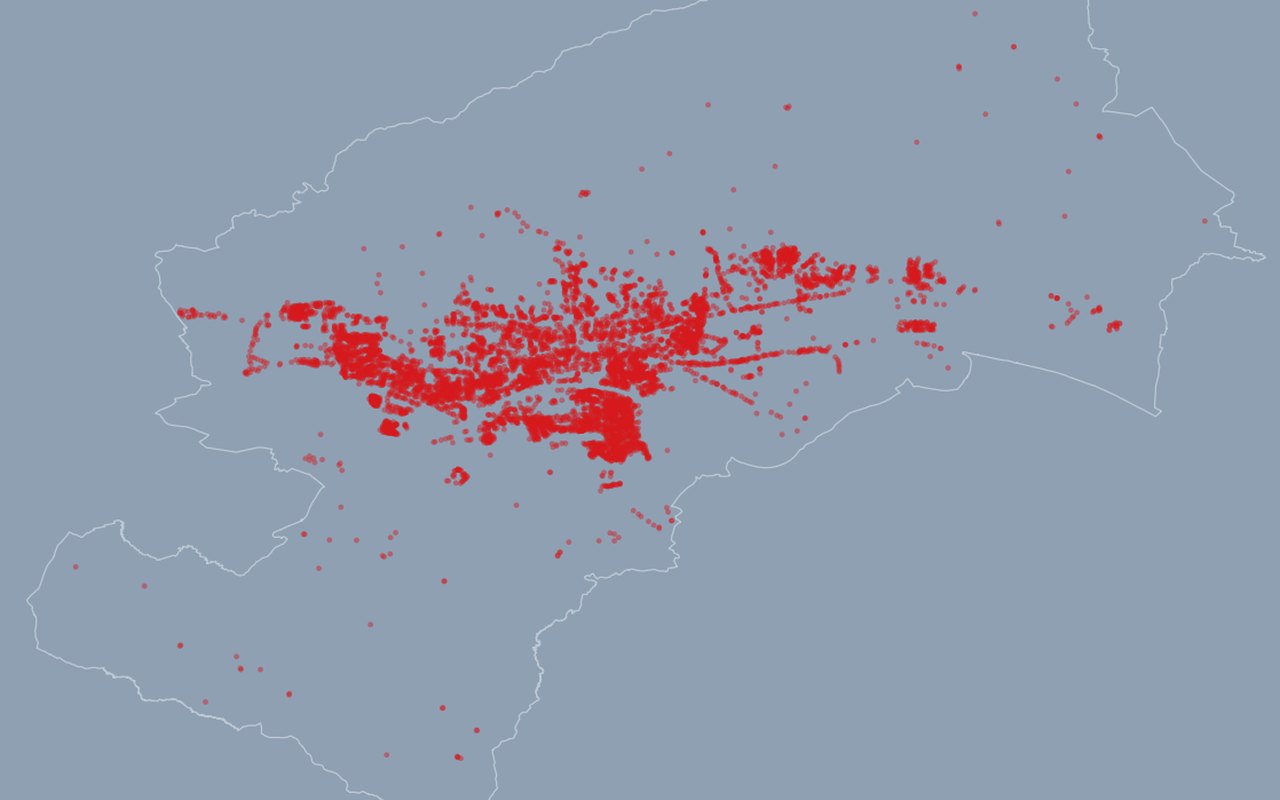
What it shows
Heatmap of tree point density (same inventory as the clustered tree layer). Heatmap of tree density from the green cadastre (blurred intensity, not individual trees).
Data sources
Derived from the green cadastre point layer (zagreb_green_cadastre_heat.json).
How it was prepared
Values are calculated for Zagreb using satellite, weather, census, and/or city open data, then drawn on the map units shown in the dashboard.