
Near-surface air temperature — MO (Summer 2024, Atmosphere 2026)
Baseline (citywide heat)
Near-surface air temperature aligned to satellite overpass time — not a full diurnal mean. Use this when comparing how hot Zagreb feels across the city on a typical summer day or night.
This is surface temperature from satellite, not the air temperature measured by weather stations or felt by pedestrians.
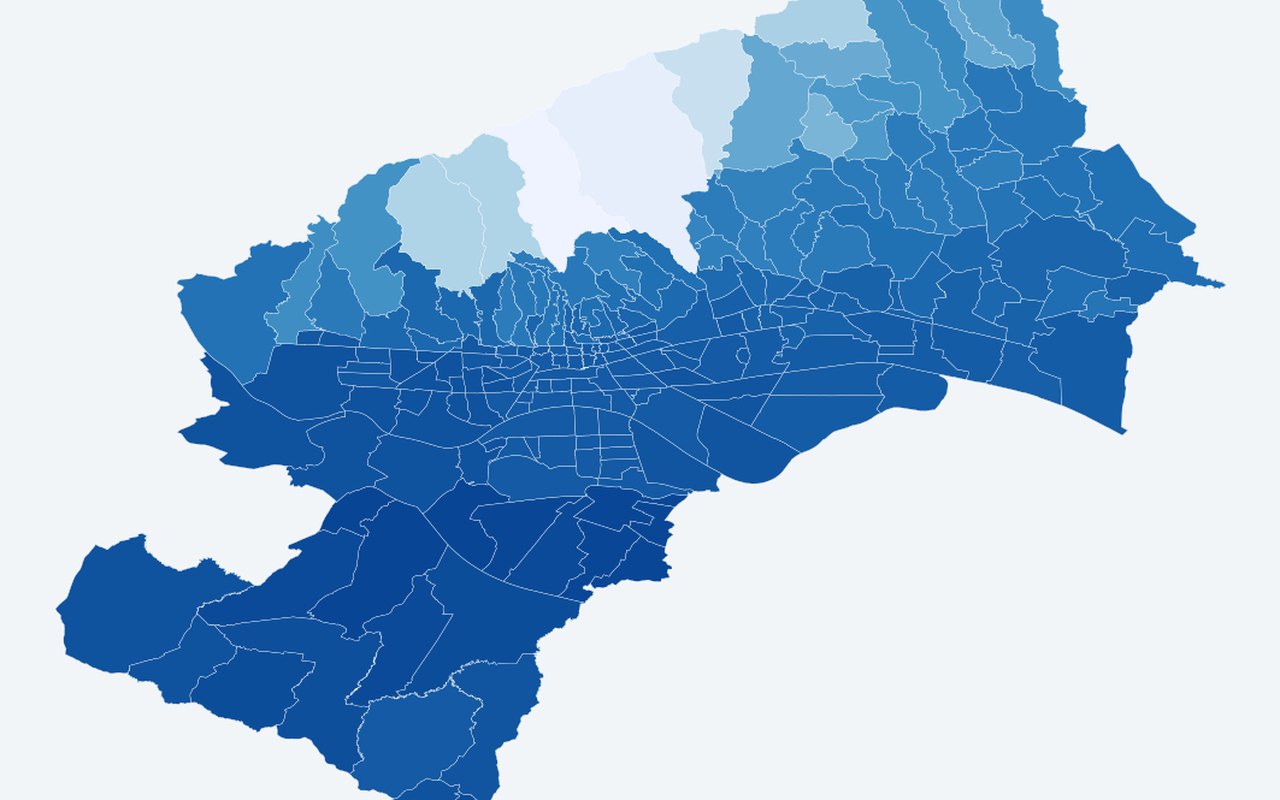
What it shows
Mean 2 m air temperature (°C) at ~11:00 CEST on each 2024 Landsat date, averaged across acquisitions (ERA5-Land via Open-Meteo).
Data sources
Open-Meteo Historical API (ERA5-Land); values assigned to neighbourhood centroids.
How it was prepared
Map adaptation of the cited study — same neighbourhood unit (218 neighbourhoods) and core methods, not a full replication. vegetation greenness/built-up intensity land-cover analysis (paper RQ3) is not shown on this map. Paper: CERRA reanalysis (5.5 km) at 09:00 UTC overpass slots. Here: ERA5-Land proxy — correlation with land surface temperature is similar (~0.59 vs paper ~0.54) but magnitudes and fine gradients differ.
Interpretation limits
Near-surface air temperature aligned to satellite overpass time — not a full diurnal mean. Surface temperature from satellites is not the same as the air temperature people feel at street level. Where this map adapts a published study, it follows the same planning units and core idea but is not a full paper replication.
Citation
Bečić, D.; Gašparović, M. (2026). Spatial Decoupling of Surface and Atmospheric Urban Heat: Differential Land Cover Associations in Zagreb. Atmosphere, 17, 466. DOI: 10.3390/atmos17050466