
Zagreb urban heat island
See where Zagreb runs hottest, who is most exposed, and where greening and shade can make the biggest difference, mapped from satellite, census, and city data.
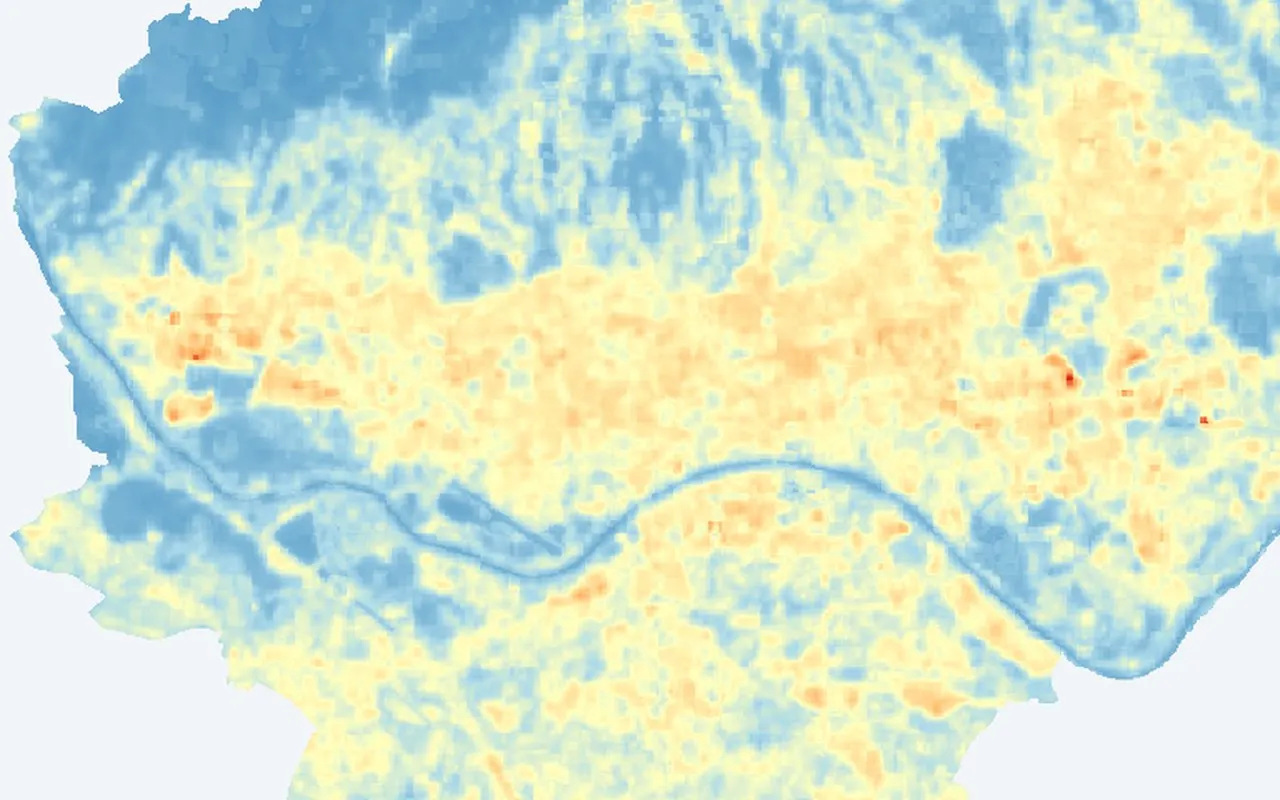
+6.5 °CMean heat-island intensity: built-up areas versus the rural/green reference in summer 2025.
- 218 neighbourhoods with heat-vulnerability scores
- 10 profiles so far
- 73 map layers
What the evidence shows
Three ways to read the citywide picture before you open the layers yourself.
- Where Zagreb runs hottestDonji Grad, Trešnjevka – sjever, and Trnje lead summer surface heat, with dense inner-city blocks consistently warmer than greener edges.
- Who is most exposedHeat risk is not only where temperatures peak, but where elderly residents, density, and limited cooling overlap in the same neighbourhoods.
- Where to act firstPriority neighbourhoods combine extreme heat, high density, and above-average elderly share. This provides a concrete starting list for trees, shade, and cool surfaces.