
GWR local β (demographic sensitivity) — Earth 2026
Vulnerability & census
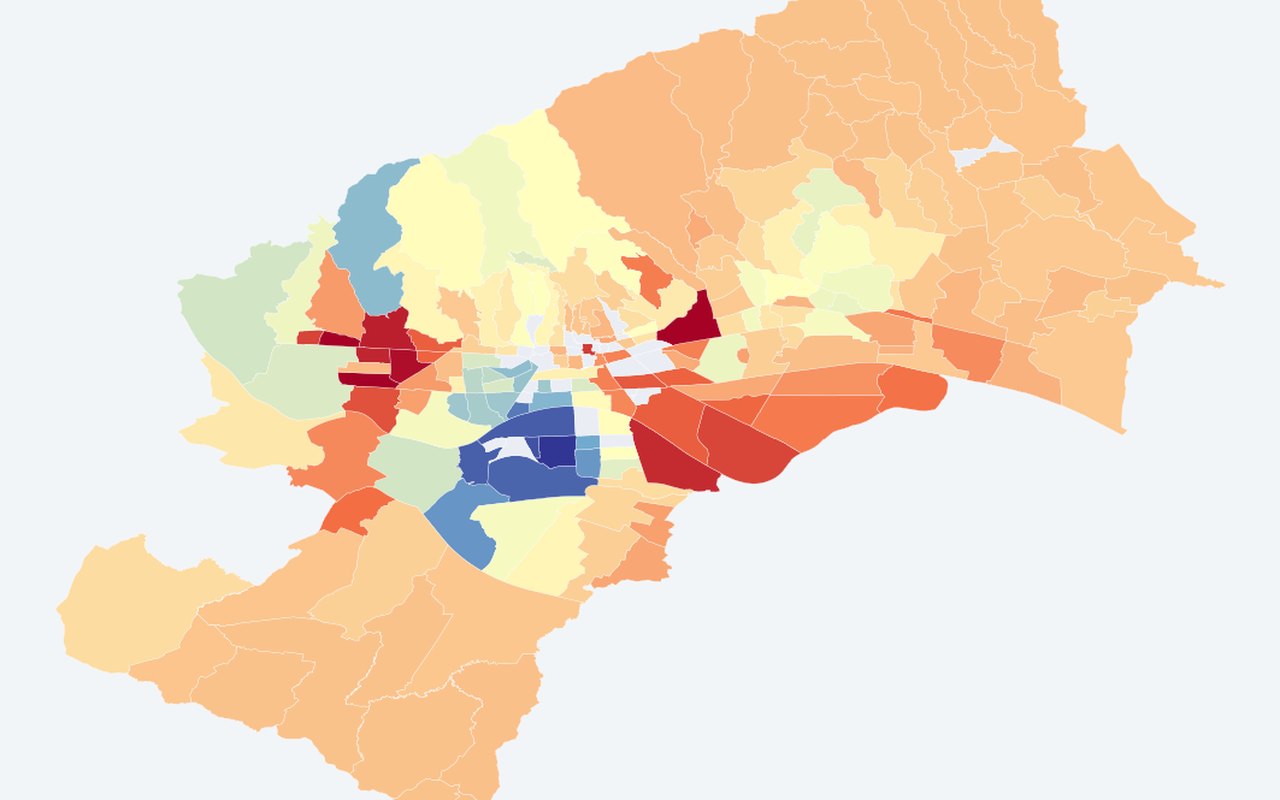
Spatially varying strength of demographic sensitivity on heat risk index (local regression diagnostic). Use this to see who lives in hotter areas and where social sensitivity is highest.
What it shows
Local β_DSI from adaptive bisquare local regression (heat risk index ~ demographic sensitivity + land surface temperature + air temperature). Higher = stronger local demographic effect.
Data sources
Census 2021 demographic sensitivity + 2024 thermal inputs; 27-neighbour adaptive kernel (Earth 2026 Model 1c analogue, cross-sectional).
How it was prepared
Map adaptation of the cited study — same neighbourhood unit and index structure, not the full 2001–2024 longitudinal analysis. Only Census 2021 is available in this project (no 2001 census neighbourhood tables). Paper: local regression on ΔHRPI ~ ΔDSI + ΔLST + ΔT_air with leave-one-out cross-validated bandwidth. Here: cross-sectional heat risk index ~ demographic sensitivity + land surface temperature + air temperature; fixed 27-neighbour kernel — interpret as diagnostic, not causal.
Interpretation limits
Spatially varying strength of demographic sensitivity on heat risk index (local regression diagnostic).
Citation
Bečić, D.; Gašparović, M. (2026). Disentangling Climate and Demographic Drivers of Urban Heat Risk: A Geographically Weighted Regression Analysis of Zagreb (2001–2024). Earth, 7, 72. DOI: 10.3390/earth7030072