
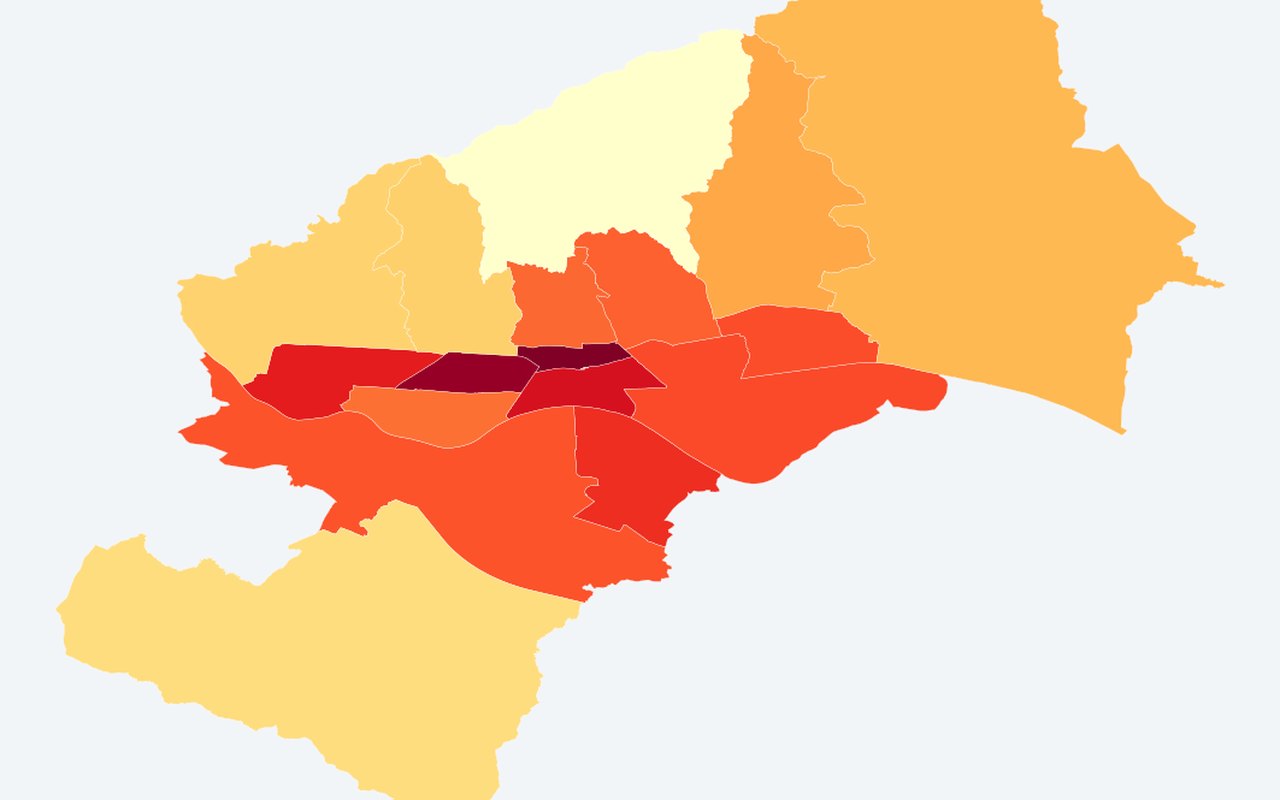
Mean LST per Neighborhood (°C)
Findings
Average daytime surface temperature per district. Use this when prioritising places for cooling, greening, or follow-up study.
What it shows
Mean Land Surface Temperature (°C) over the analysis window. District mean land surface temperature.
Data sources
Google Earth Engine summer composite: Landsat 8/9 Collection 2 ST_B10 (default) or MODIS/061/MOD11A2 when MODIS is selected.
How it was prepared
Indicators are calculated from the project’s Zagreb heat, greenery, and population analyses, then drawn on planning-relevant units (neighbourhoods, districts, or parcels).