
GWR local R² — Earth 2026
Vulnerability & census
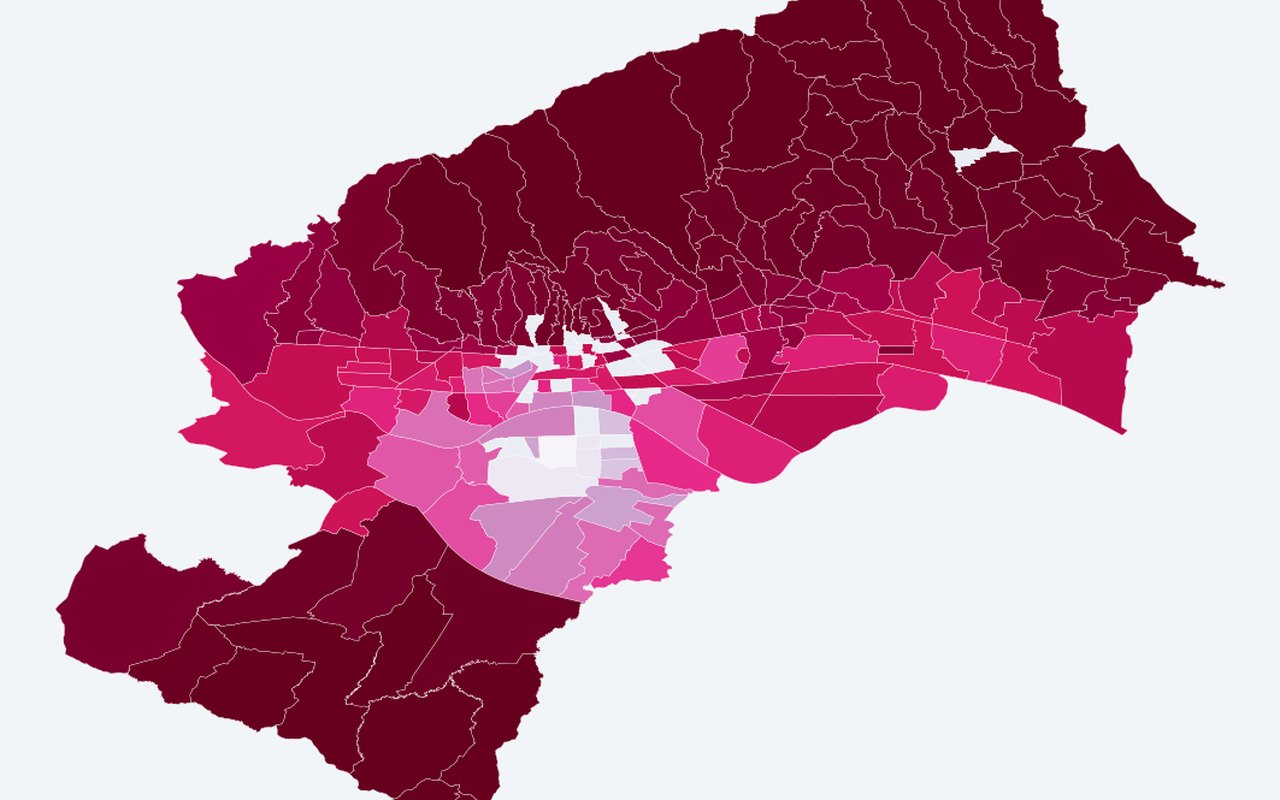
Where the three-predictor local regression explains heat risk index variation best. Use this to see who lives in hotter areas and where social sensitivity is highest.
What it shows
Local R² from local regression windows (0–1). Peripheral neighbourhoods often show higher fit than complex central zones.
Data sources
Same local regression specification as β_DSI layer.
How it was prepared
Map adaptation of the cited study — same neighbourhood unit and index structure, not the full 2001–2024 longitudinal analysis. Only Census 2021 is available in this project (no 2001 census neighbourhood tables). Paper: local R² for ΔHRPI (Model 1c). Here: R² for 2024 heat risk index levels — useful for spatial fit patterns, not directly comparable to published Fig. 5 values.
Citation
Bečić, D.; Gašparović, M. (2026). Disentangling Climate and Demographic Drivers of Urban Heat Risk: A Geographically Weighted Regression Analysis of Zagreb (2001–2024). Earth, 7, 72. DOI: 10.3390/earth7030072