
Citizen survey heat burden
Vulnerability & census
How residents report coping with heat, joined to districts / neighbourhoods. Use this to see who lives in hotter areas and where social sensitivity is highest.
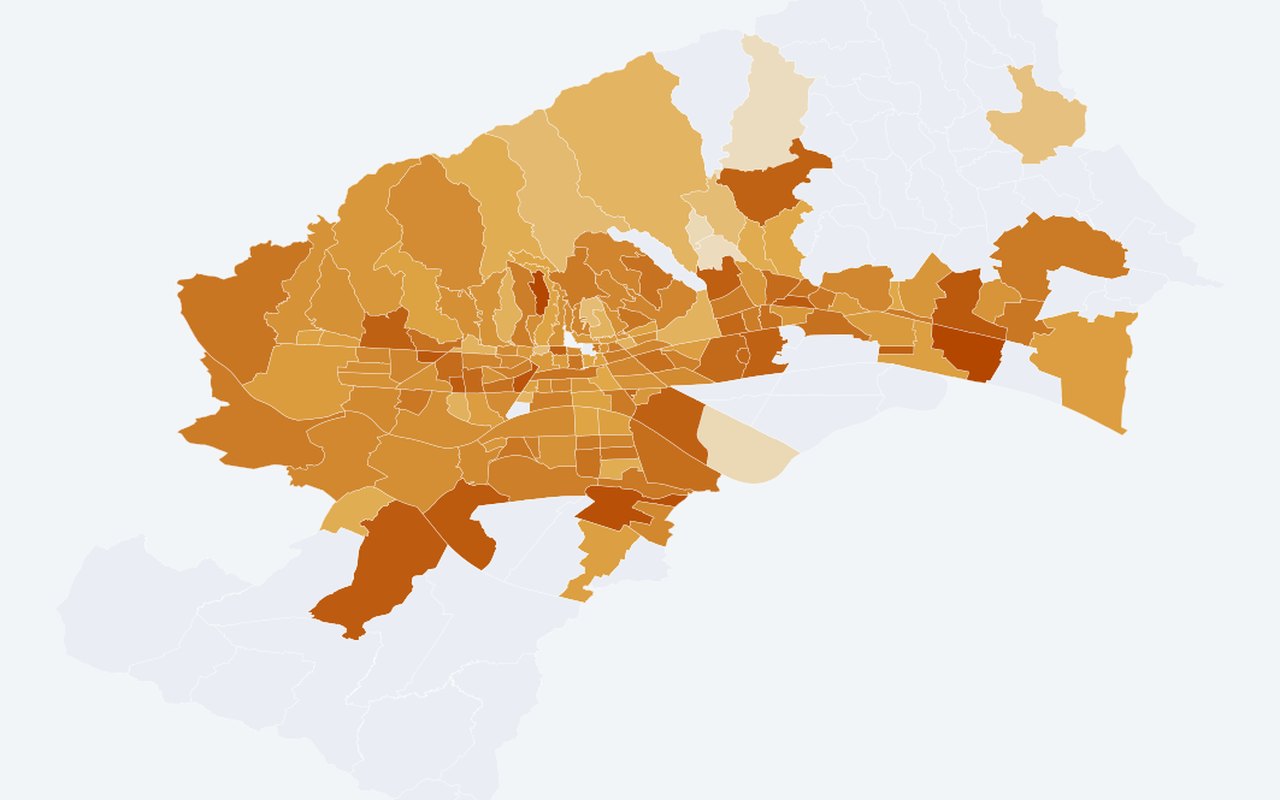
What it shows
Survey-derived heat-burden and vulnerability indicators on neighbourhood or district polygons. Self-reported heat burden index (neighbourhood).
Data sources
Citizen heat-burden survey responses processed by.
How it was prepared
Census and related demographic tables are joined to official neighbourhood polygons so heat and people can be read together on one map.