
LST — MO polygons (Summer 2024, Atmosphere 2026)
Baseline (citywide heat)
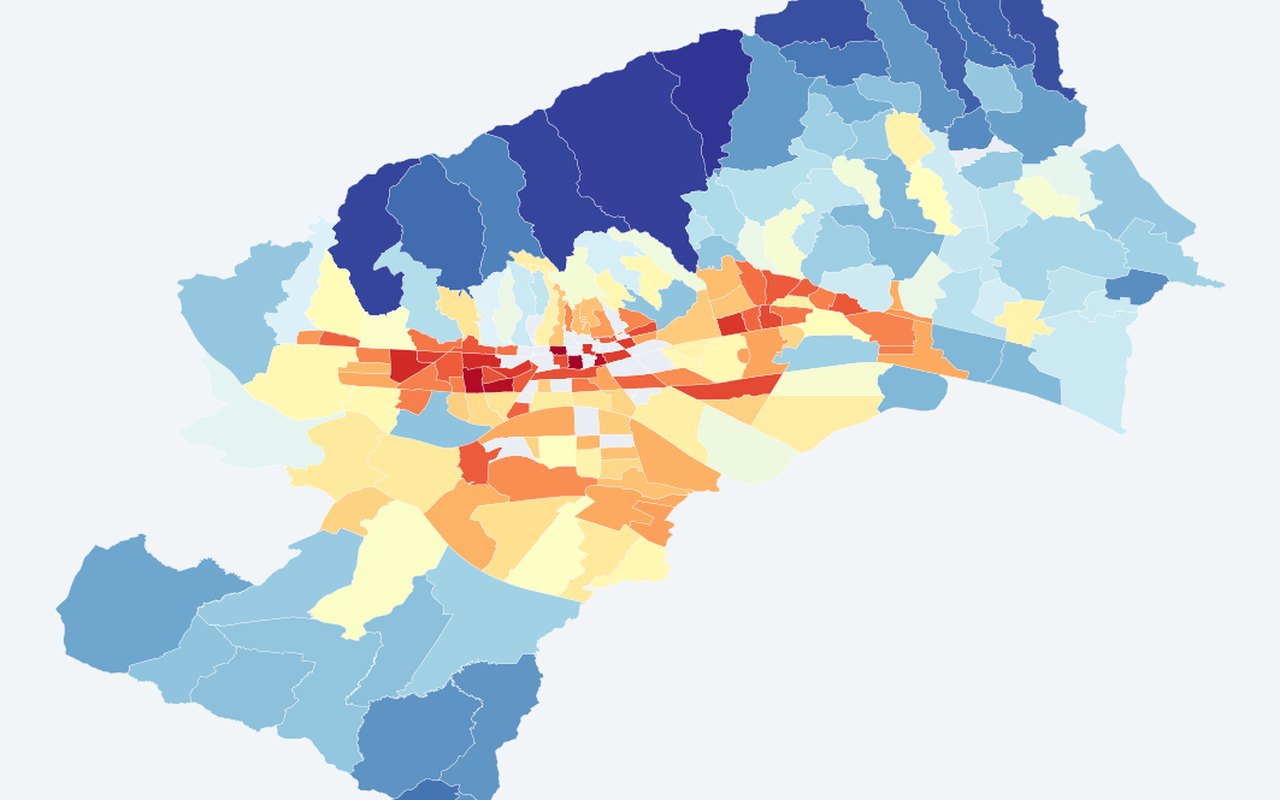
Land-surface temperature aggregated to Zagreb's 218 neighbourhoods for summer 2024. Use this when comparing how hot Zagreb feels across the city on a typical summer day or night.
What it shows
Mean Landsat 8/9 land surface temperature (°C) per neighbourhood from the paper's 2024 acquisition window. Higher = hotter surface.
Data sources
Landsat 8/9 Collection 2 summer composite (config zagreb_landsat_dates_2024); neighbourhood means via point-in-polygon join on cached 30 m samples.
How it was prepared
Map adaptation of the cited study — same neighbourhood unit (218 neighbourhoods) and core methods, not a full replication. vegetation greenness/built-up intensity land-cover analysis (paper RQ3) is not shown on this map. Paper: zonal means from full raster (exactextractr). Here: sample-point aggregation — some neighbourhoods may lack land surface temperature where few Landsat pixels fall inside the polygon.
Interpretation limits
Where this map adapts a published study, it follows the same planning units and core idea but is not a full paper replication.
Citation
Bečić, D.; Gašparović, M. (2026). Spatial Decoupling of Surface and Atmospheric Urban Heat: Differential Land Cover Associations in Zagreb. Atmosphere, 17, 466. DOI: 10.3390/atmos17050466