
About this project
Zagreb UHI helps city planners, researchers, and residents see where the city runs hottest in summer, who lives in those places, and where greening and shade can make the biggest difference, so heat risk can inform planning with shared, map-ready evidence.
Scope
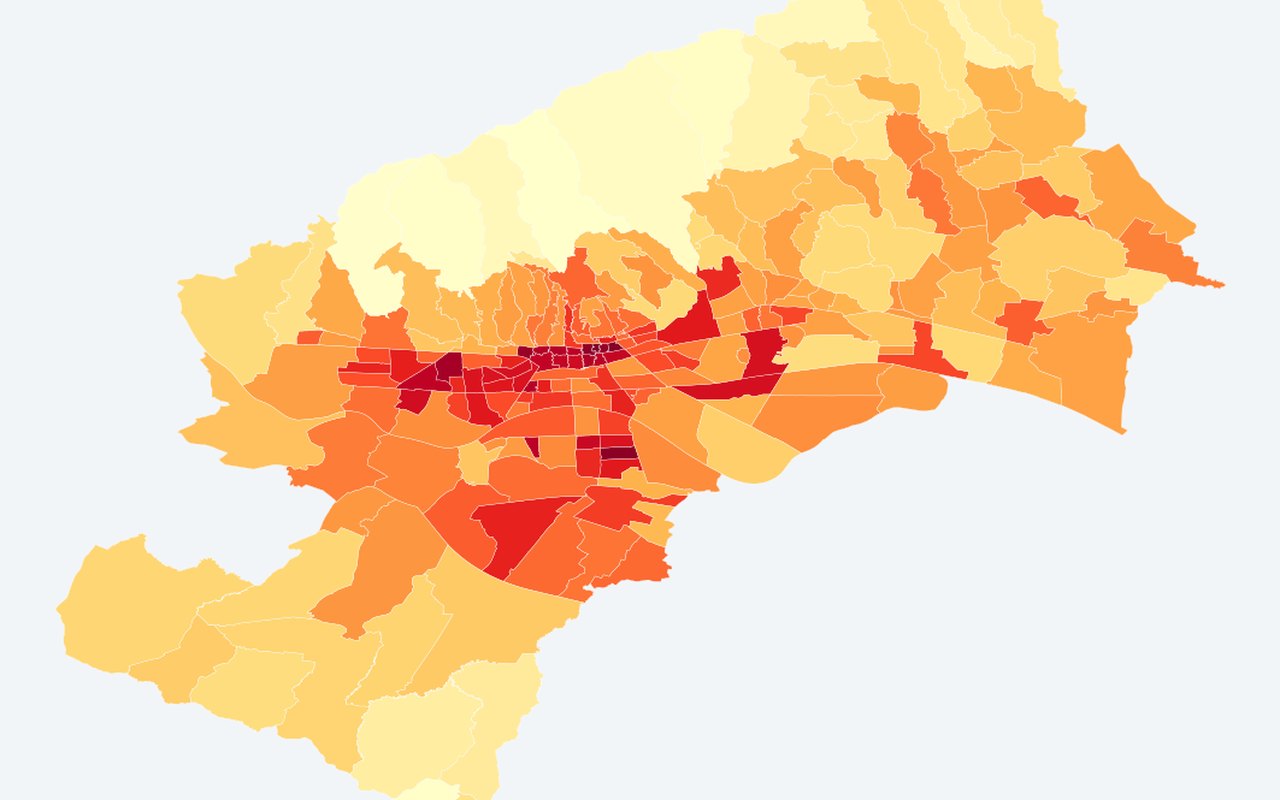
Citywide map layers cover Zagreb’s 17 districts and 218 neighbourhoods (mjesni odbori). Detailed neighbourhood profiles currently start with Trešnjevka – sjever (10 neighbourhoods). Heat maps draw on summer satellite and weather data; population context uses the 2021 census.
Partners
Developed by SmartUp - Social Innovation Lab and Korimako, in collaboration with the City of Zagreb.


Interpretation
Land surface temperature from satellites is not the same as the air temperature people feel at street level. Treat map colours as surface heat context, and read air-temperature and survey layers alongside them. See land surface temperature methods and the Findings limits section for more detail.
Evidence behind the maps
Full methods for every layer live on Data and Methods. The work draws on four kinds of input:
Satellite observations
Summer land-surface temperature from Landsat and ECOSTRESS, plus vegetation greenness trends from Sentinel-2.
Weather measurements
Official station air temperature at Grič, Maksimir, and Pleso for comparison with surface heat.
Population and resident surveys
2021 census age and density by neighbourhood, education by district, and citizen heat-burden survey responses.
City infrastructure and geography
Schools, healthcare, fountains, greenery, and neighbourhood and planning boundaries used for exposure and intervention context.
Citation
Related peer-reviewed analysis of surface and atmospheric heat in Zagreb:
Bečić, D.; Gašparović, M. (2026). Spatial Decoupling of Surface and Atmospheric Urban Heat: Differential Land Cover Associations in Zagreb. Atmosphere, 17, 466. DOI: 10.3390/atmos17050466