
Tree cover deficit
Greenery
Supports greening plans by linking canopy gaps to places that already score high on heat vulnerability.
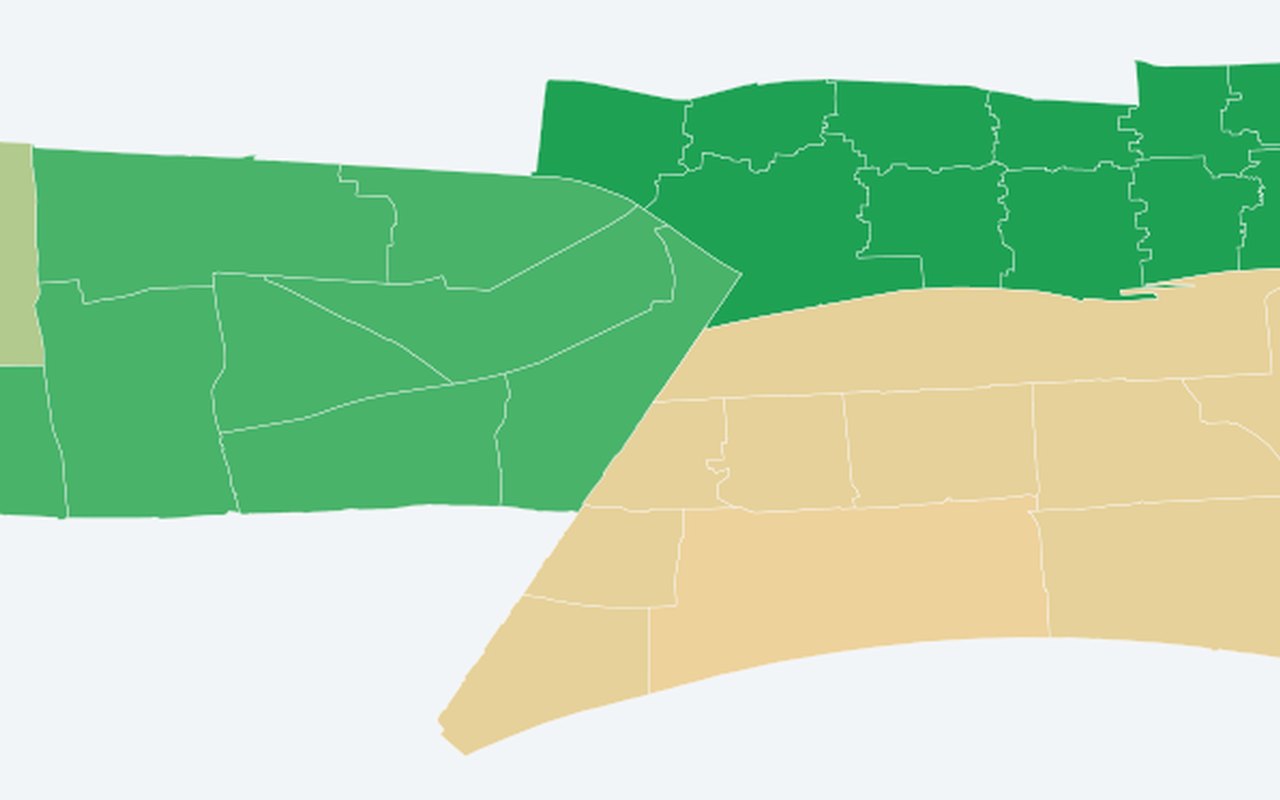
What it shows
Shows where high heat-vulnerability neighbourhoods still lack tree canopy relative to a realistic greening target, and where planting could cool the most.
Data sources
Neighbourhood vegetation greenness, heat vulnerability scores, and a realistic canopy target based on greener Zagreb districts.
How it was prepared
Canopy shortfall is estimated from greenness patterns and compared with vulnerability so deficit and need can be read together.