
MODIS Nighttime LST (°C)
Satellite rasters
Nighttime heat stress indicator — directly shows where nights stay warm. Use this as a citywide satellite backdrop — helpful for seeing fine-grained patterns behind neighbourhood averages.
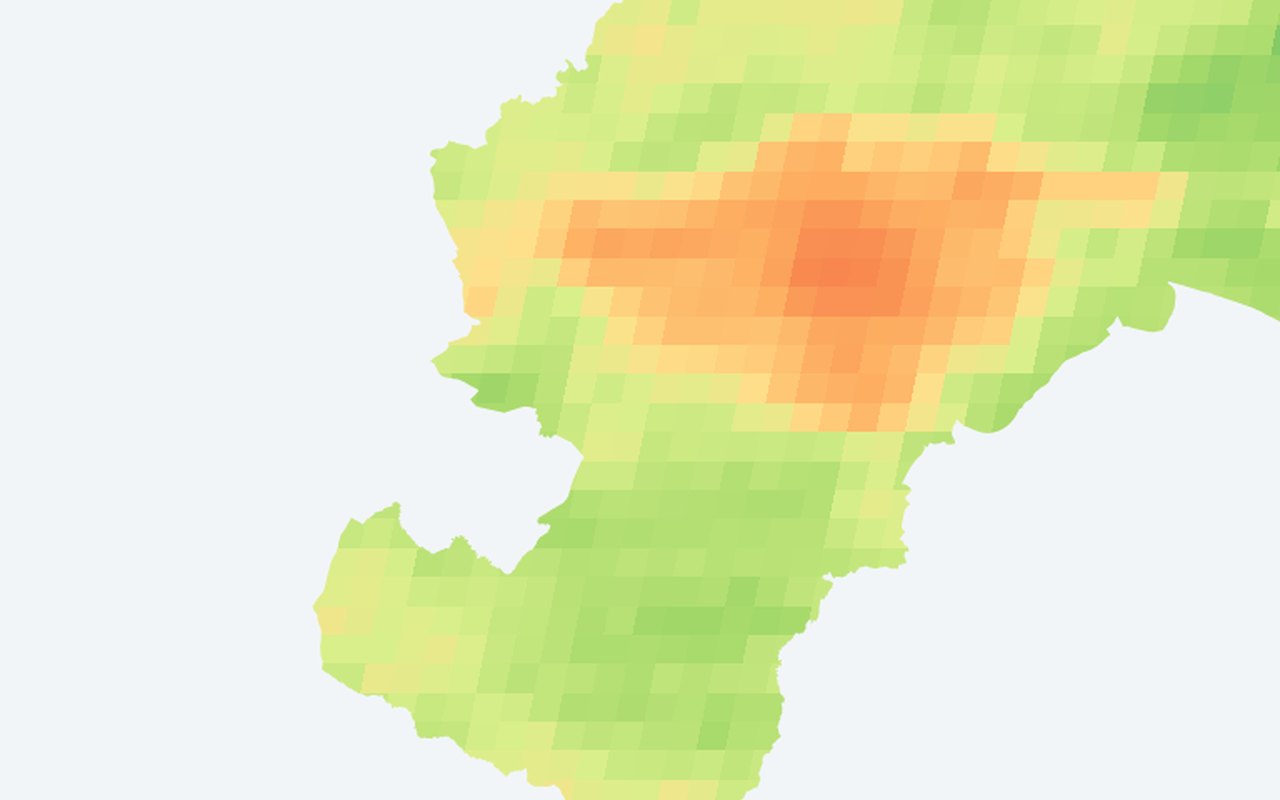
What it shows
Mean nighttime land surface temperature from MODIS, averaged over summer. Warm nights (red, 24–28 °C) = heat retained overnight → dangerous for health because the body cannot recover from daytime heat stress. Cool nights (green, 12–16 °C) = effective cooling, typically vegetated/elevated areas. Resolution is ~1 km (neighbourhood scale).
Data sources
MODIS Terra daily (MOD11A1.061) LST_Night_1km band (~22:30 local overpass), quality control-masked (bits 0-1 ≤ 1, 'land surface temperature produced') and valid-range filtered (DN ≥ 7500) to exclude cloud-contaminated and fill pixels. Scale factor 0.02, converted to °C, averaged over the analysis summer window. Inspired by the TALEA platform (Municipality of Bologna, EUI-IA).
How it was prepared
Satellite scenes are filtered for cloud and quality issues, converted to the mapped indicator, and published as map tiles clipped to Zagreb.