
Urban Heat Exposure Index (UHEI)
Satellite rasters
Composite risk score combining three simultaneous heat drivers into one layer. Use this as a citywide satellite backdrop — helpful for seeing fine-grained patterns behind neighbourhood averages.
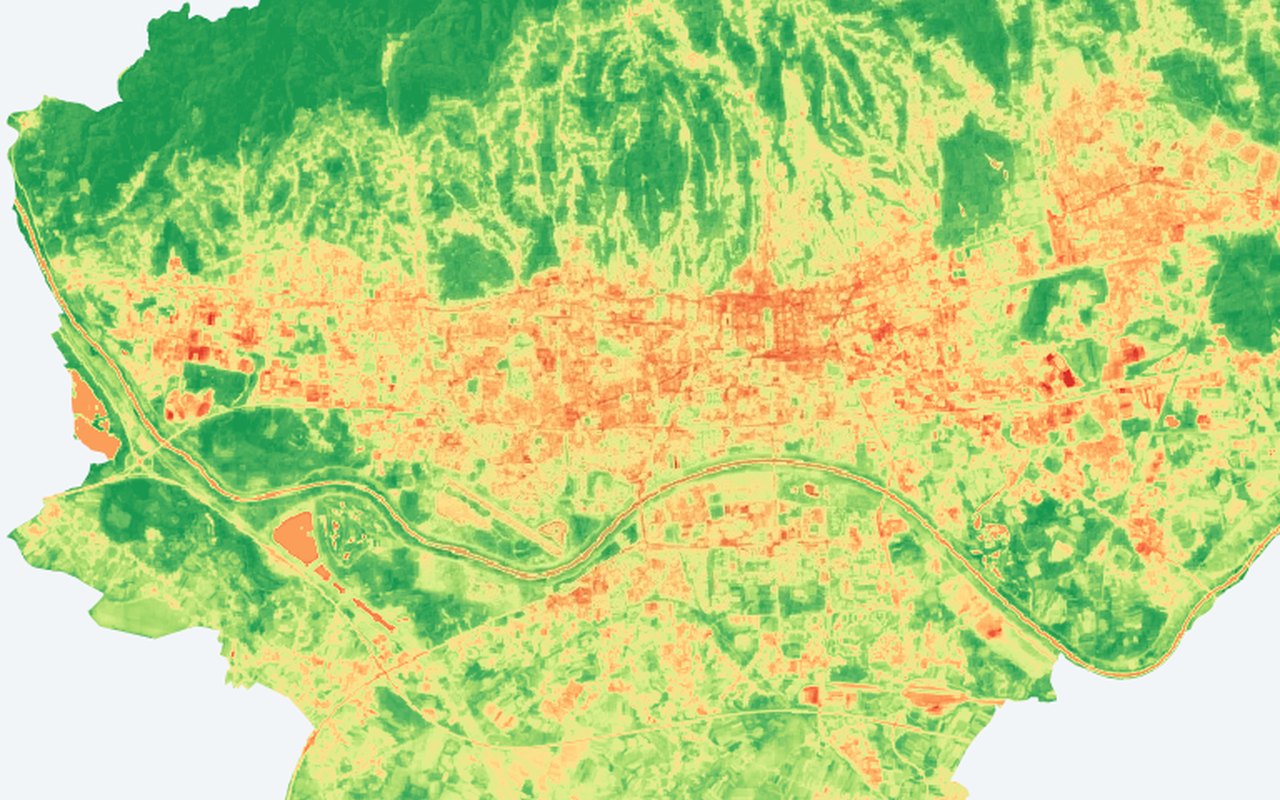
What it shows
UHEI = LST_norm + (1 − NDVI_norm) + (1 − Albedo_norm). Range: 0 (best) to 3 (worst). Green (low UHEI) = cool, vegetated, reflective surfaces. Red (high UHEI) = hot, bare, dark surfaces — where all three risk factors stack up. Differs from the Composite UHI Index (temperature minus vegetation greenness) by adding albedo as a third dimension: captures surface material reflectivity that vegetation greenness alone misses (e.g. light vs dark parking lots score differently).
Data sources
land surface temperature normalized 30–50 °C, vegetation greenness normalized 0–0.8, Albedo (Liang 2001) normalized 0.05–0.35, all from Landsat 8/9 SR via Google Earth Engine. Formula and normalization ranges follow the TALEA platform (Municipality of Bologna, EUI-IA).
How it was prepared
Satellite scenes are filtered for cloud and quality issues, converted to the mapped indicator, and published as map tiles clipped to Zagreb.