
Hot districts
Findings
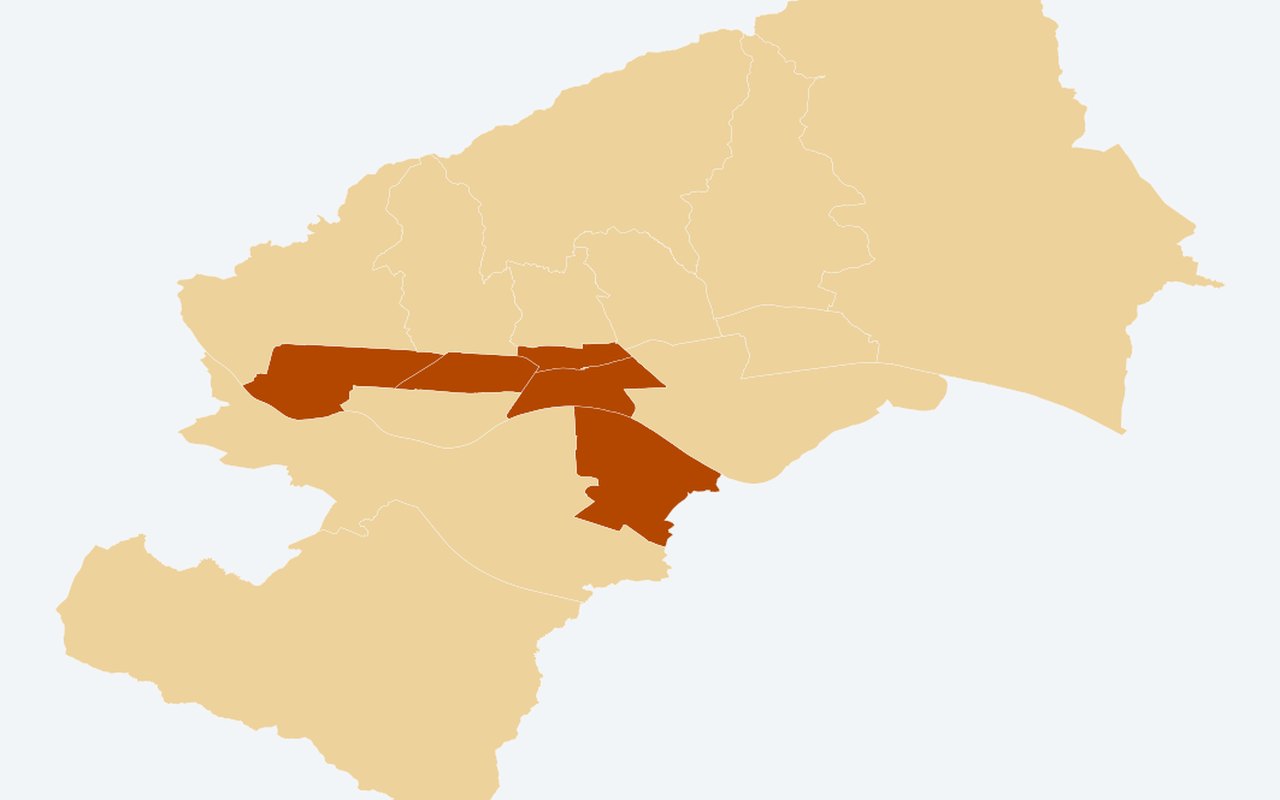
Which of Zagreb’s 17 districts exceed the citywide hot threshold. Use this when prioritising places for cooling, greening, or follow-up study.
What it shows
District polygons classified Hot vs Other using mean UHI anomaly ≥ 75th percentile. Districts above the city ΔT hot threshold.
Data sources
District thermal summary (analysis_hot_districts.csv) joined to Grad Zagreb district boundaries.
How it was prepared
Indicators are calculated from the project’s Zagreb heat, greenery, and population analyses, then drawn on planning-relevant units (neighbourhoods, districts, or parcels).