
Street hotspot ranking
Findings
Helps discuss street-level cooling priorities in a compact pilot sample — not a full city street inventory.
What it shows
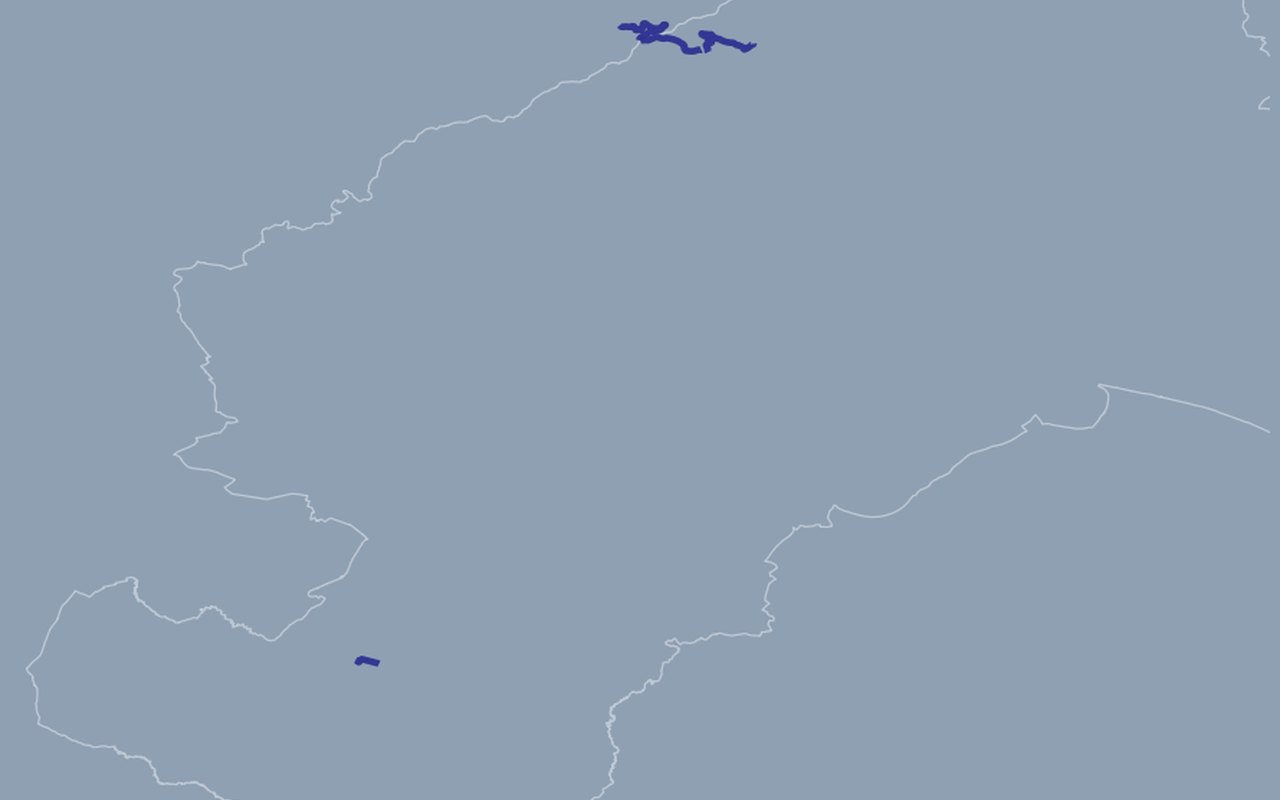
A small set of pilot street segments ranked by how hot their surfaces are. Higher scores mark streets that may need shade or greening first.
Data sources
OpenStreetMap street geometry sampled against Zagreb land-surface temperature and hotspot indicators.
How it was prepared
Each pilot segment receives a priority score from nearby heat samples and is drawn as a coloured line.
Interpretation limits
Only a handful of pilot streets are included; do not treat this as a citywide ranking of every road.