
Where Zagreb runs hottest — and who lives there
During summer 2025, Zagreb’s historic core was on average6 to 10 °C hotter at the land surface than its green periphery. The hottest neighbourhoods overlap almost exactly with where the most people live, where the oldest residents are concentrated, and where several busy outdoor markets sit.
+6.5 °C mean heat-island intensity5 districts above the hot threshold32 dense neighbourhoods in hot districts−0.77 greener pixels are cooler
Main finding
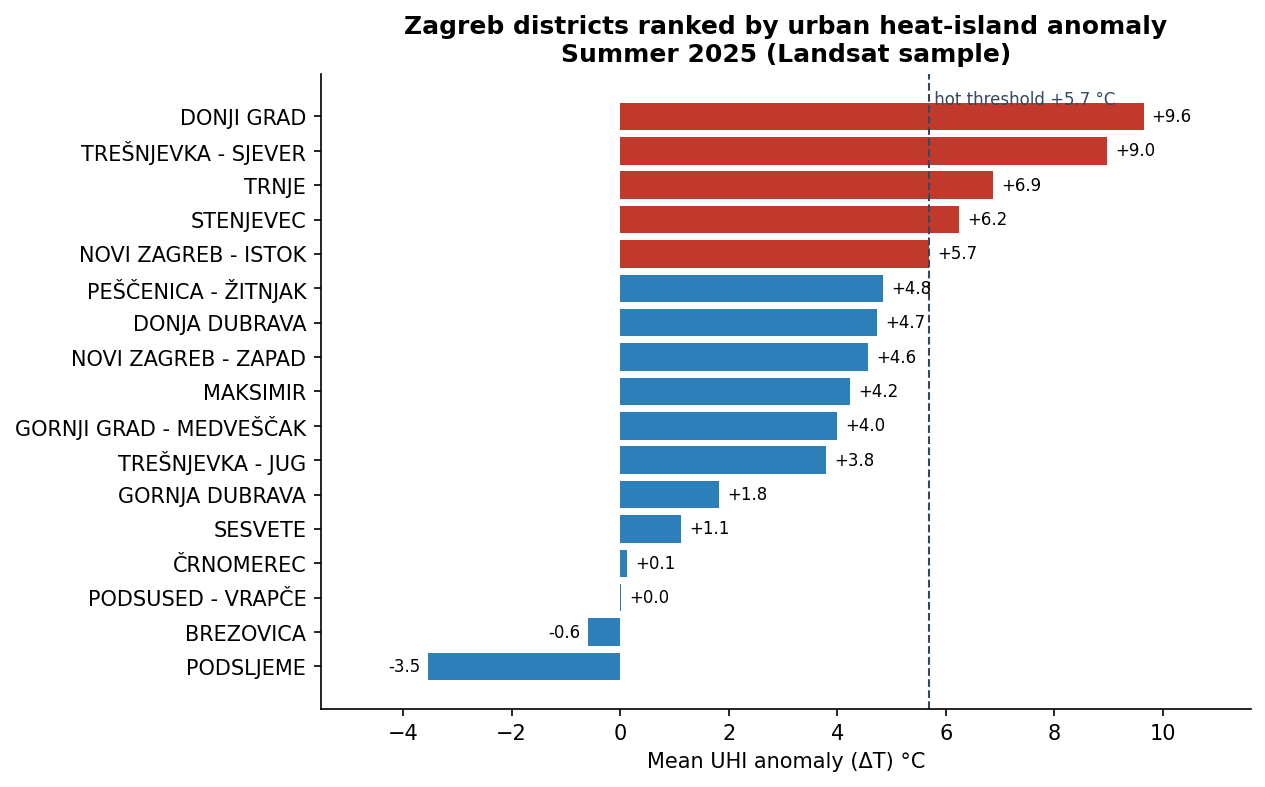
Five districts stand out:Donji Grad, Trešnjevka – sjever,Trnje, Stenjevec, andNovi Zagreb — Istok. Within them,32 neighbourhoods combine extreme heat with extreme population density — twelve of those are in Donji Grad alone, which also has the highest shares of residents aged 65+ in some areas (over 40%).
 Open full-size chart
Data table for this chart
| District | Mean ΔT (°C) |
|---|---|
| Donji Grad | +9.6 |
| Trešnjevka – sjever | +9.0 |
| Trnje | +6.9 |
| Stenjevec | +6.2 |
| Novi Zagreb — Istok | +5.7 |
| Podsljeme | −3.5 |
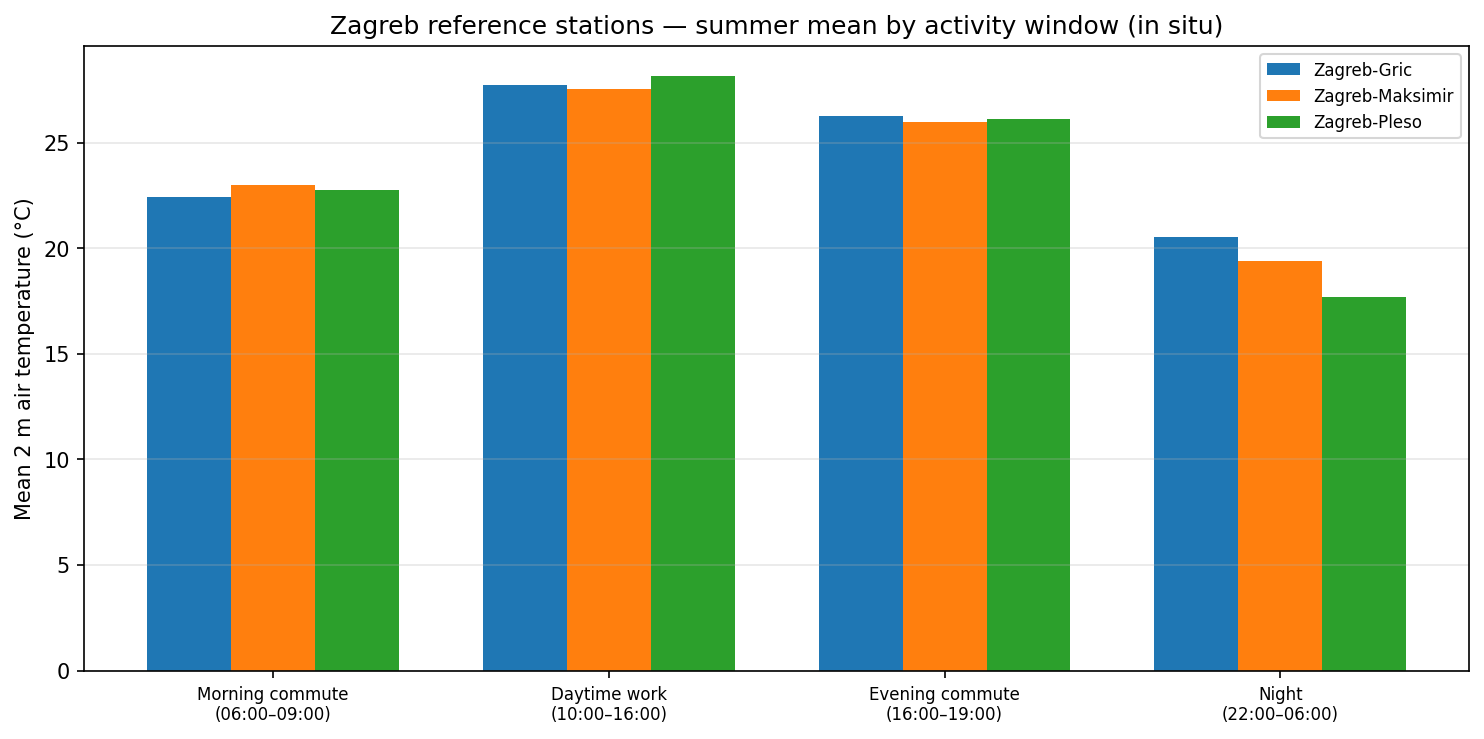
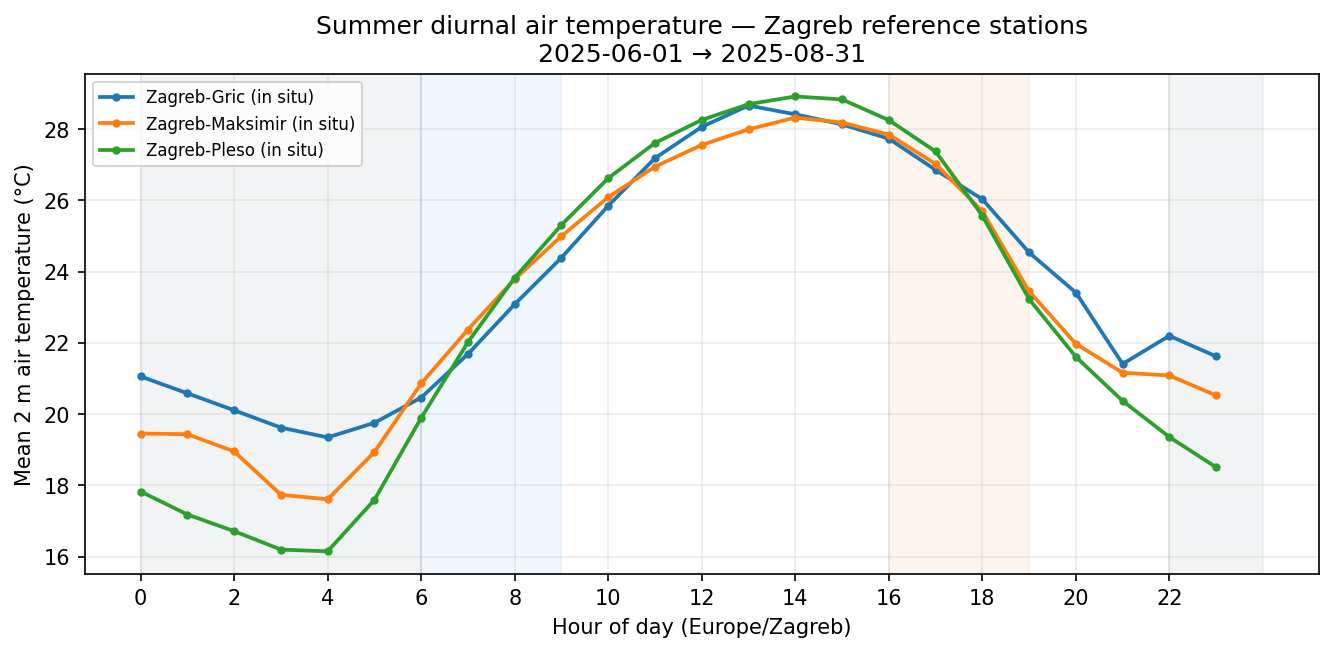
Complementary air temperature (three reference stations) shows hot afternoons often reaching the mid-30s °C, while seasonal averages sit nearer ~28 °C. Night-time land-surfacesnapshots show a much narrower spread (~17–21 °C) than daytime heat, with the inner city still slightly warmest.
Key numbers
| Measure | Value |
|---|---|
| Mean land-surface temperature, citywide | 33.1 °C |
| Urban heat-island intensity (built-up − rural) | +6.5 °C |
| Hottest district (Donji Grad), mean heat anomaly | +9.6 °C |
| Coolest district (Podsljeme), mean heat anomaly | −3.5 °C |
| Dense and hot neighbourhoods | 32 of 218 |
| Vegetation index vs surface temperature | −0.77 |
| Max heat-vulnerability index (HVI) | 0.76 (Nadbiskup Antun Bauer) |
| Facilities inside 32 hot + dense MOs | 242 |
| Hot + dense MOs with zero drinking fountains | 30 of 32 |
| City-wide heatwaves (DHMZ-style), summer 2025 | 3 events |
| Thermal-priority residential parcels (2025 / 2024) | 481 / 433 |
Research questions & answers
The study addressed ten practical questions about where heat concentrates, how strong it is, who is affected, and what complementary satellite and weather data add.
Question 1
Where in the city is it hottest?
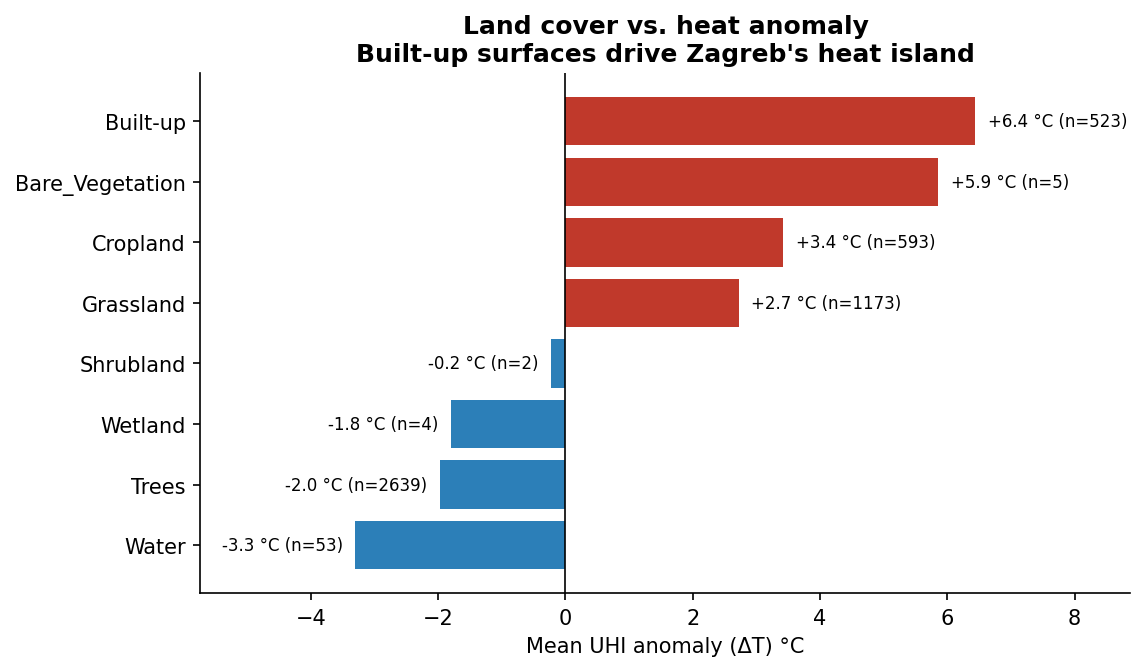
The hottest surfaces are in the dense inner city. Donji Grad, Trešnjevka – sjever, and Trnje average about42, 41, and 39 °C land-surface temperature; green Podsljeme averages 29 °C — roughly a13 °C spread across the city in one summer. Built-up areas average 39 °C; tree cover 31 °C; water 29 °C.
Open full-size chartQuestion 2
How strong is the heat island?
Built-up areas are on average +6.5 °C warmer than the rural/green reference. Five districts exceed the citywide “hot” threshold (75th percentile, ΔT ≥ +5.7 °C):
- Donji Grad — +9.6 °C
- Trešnjevka – sjever: +9.0 °C
- Trnje — +6.9 °C
- Stenjevec — +6.2 °C
- Novi Zagreb — Istok — +5.7 °C
Podsljeme (−3.5 °C) and Brezovica (−0.6 °C) sit below the reference. The gradient runs from the green north hillside through the overheated centre to mixed southern and eastern fringes.
Question 3
Does vegetation cool the city?
Yes, clearly. Greener pixels are reliably cooler (correlation −0.77). Podsljeme is the greenest and coolest district; Donji Grad the least green and hottest. Tree cover can shift a pixel’s heat anomaly from about +6 °C in built-up areas to −2 °C under trees.
 Open full-size chart
Question 4
Do official green zones work as a cool reference?
Yes. Districts with more officially mapped green (Podsljeme, Brezovica, Podsused — Vrapče) sit at the cool end. Where the green plan exists on the ground, it buffers temperatures. The urban core lacks that buffer — Donji Grad and Trnje are short on both mapped green and live vegetation.
Question 5
Who lives where it is hot?
32 neighbourhoods are in both the top quartile for population density and a top-quartile hot district — spread across all five hot districts (12 in Donji Grad, 7 in Trešnjevka – sjever, 5 in Trnje, 4 in Stenjevec, 4 in Novi Zagreb — Istok). The densest include Matko Laginja (~24,000 people/km²) and Nadbiskup Antun Bauer (~20,500 people/km²).
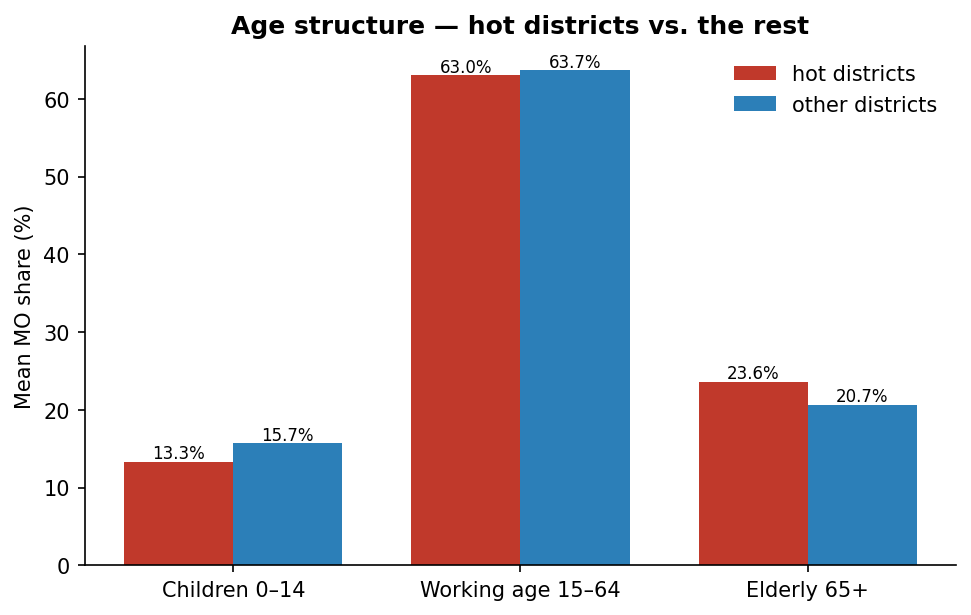
Residents aged 65+ concentrate in Donji Grad (e.g. Hrvatski narodni vladari 46%, Mimara 42%) and Trnje (Cvjetnica 38%) — also the hottest areas. Children (0–14) peak in parts of Novi Zagreb — Istok (Veliko Polje, Jakuševec), itself a hot district.
Question 6
What does the ECOSTRESS satellite add?
ECOSTRESS gives a finer (~70 m) but irregular view of land-surface temperature. It is best treated as acompanion to Landsat: Landsat supports citywide summer statistics; ECOSTRESS helps confirm local hot pockets where it passes over. The spatial pattern agrees with Landsat despite different overpass times.
Question 7
Which residential areas should be prioritised for heat mitigation?
A screening flagged 20 residential parcels with unusually low vegetation and high surface temperature — mostly dense inner-city housing. They align with the highest-scoring planning units and are strong candidates for trees, façade greening, and surface treatments. Boundaries should be confirmed on the interactive map before policy use.
Question 8
Does the composite heat index match the district picture?
Mostly yes. Both the simple district ranking and a composite index identify the same hot core: Donji Grad, Trešnjevka — Sjever, Trnje. Once vegetation and green-zone share are considered,built-up area alone is not a significant driver — missing greenery and impervious surfaces matter more than density labels alone.
Air temperature, daily rhythms & elderly exposure
Question 9
People experience air temperature, not roof temperature — and when heat peaks (commute, work, night) matters for health messaging as much as where on the map.
What the weather stations show
Three reference stations (Grič city centre, Maksimir, Pleso) were analysed for June–August 2025. Seasonal averagesunderstate discomfort: afternoon work hours (10:00–16:00) average ~28 °C, but 95th-percentile days reach ~34 °C and individual heatwave hours hit the mid-30s (Pleso peak37.7 °C). Pleso is slightly warmer by day butcoolest at night (~17.7 °C mean); Grič stays warmer overnight than Maksimir.
| Station | Daytime mean (10–16) | Hot-day tail (95th %) | Hottest hour | Night mean (22–06) |
|---|---|---|---|---|
| Grič (centre) | 27.7 °C | 34.1 °C | 36.6 °C | 20.5 °C |
| Maksimir | 27.6 °C | 34.0 °C | 36.6 °C | 19.4 °C |
| Pleso (open) | 28.2 °C | 35.0 °C | 37.7 °C | 17.7 °C |
Modelled air at neighbourhood scale
A European reanalysis product (bias-corrected using the three stations) underestimates daytime summer air by roughly0.7–1.1 °C. After correction, estimated neighbourhood air spans only 24.9–27.8 °C citywide (σ ≈0.45 °C) — the grid is too coarse for block-level differences. Use stations for absolute air and timing; use the map layer for relative ranking combined with census.
Land surface vs air
Where both are available, land surface is on average7.7 °C hotter than air at neighbourhood centroids (range +2.4 to +14.7 °C). Health and comfort narratives need both: satellites show surface hotspots; thermometers show breathed air.
Elderly heat exposure on the map
The map layer Elderly heat exposure score combines share of residents aged 65+ with ranked modelled daytime air. Because neighbourhood air is nearly uniform spatially, the pattern is driven mainly by who lives where, with a modest boost where air sits in the upper tail.
Highest-scoring neighbourhoods:
| Neighbourhood | District | Share aged 65+ | Est. air (°C) |
|---|---|---|---|
| Hrvatski narodni vladari | Donji Grad | 46% | 27.5 |
| Mimara | Donji Grad | 42% | 27.5 |
| Cvjetnica | Trnje | 38% | 27.5 |
| August Cesarec | Gornji Grad — Medveščak | 36% | 27.4 |
| Sloboština | Novi Zagreb — Istok | 32% | 27.5 |
Night-time land-surface temperature
Question 10
This addresses night-time heat retention at the ground and roof surface — relevant for sleep comfort — not the same as night air temperature (see Question 9).
Three clear night satellite passes were found in early July 2025; two were combined for the map composite. Night surface temperatures were much more uniform across the city (~14–21 °C at neighbourhood scale) than daytime Landsat heat (~33 °C city mean). Typical swath medians were about18–19 °C. Coverage is patchy; treat this as a snapshot, not a full summer night climatology.
| Metric | Daytime (Landsat summer) | Night (ECOSTRESS Jul) |
|---|---|---|
| Citywide mean / typical | ~33 °C LST | ~18–19 °C LST |
| Approx. district spread | ~13 °C (29 – 42 °C) | ~4 °C (fringe – inner core) |
| Scenes used | Multi-date summer composite | 2 of 3 clear night swaths |
Warmest districts: Donji Grad and Trnje (~20.6 °C).Coolest fringe: Brezovica (~16.7 °C). Inner-city neighbourhoods (Petar Krešimir IV., Vrbik, Kralj Zvonimir, etc.) rank highest but only ~0.2–1 °C above the city average. Eastern Sesvete fringe areas are coolest (~14–15 °C).
Station night air (22:00–06:00) runs Grič ~20.5 °C, Maksimir ~19.4 °C, Pleso ~17.7 °C — similar order of magnitude to nightsurface medians, but the two should not be read as the same number for a given neighbourhood.
Pair night LST with the Elderly × warm night LST layer on the dashboard. Because night surface spread is small, high elderly-share areas in Donji Grad and Trnje still dominate the score — similar to the daytime exposure layer.
Heatwave detection & spatial disparity
Question 11
Using the DHMZ-style definition (≥3 consecutive days with Tmax ≥30 °C and Tmin ≥20 °C — a tropical night), the analysis detected 3 city-wide heat waves in summer 2025, consistent with the official DHMZ assessment.
| Event | Start | End | Duration |
|---|---|---|---|
| HW 1 | 5 Jul | 9 Jul | 5 days |
| HW 2 | 16 Jul | 25 Jul | 10 days |
| HW 3 | 4 Aug | 7 Aug | 4 days |
When detection runs independently for each of the 218 MO centroids, a10× spatial disparity emerges: eastern lowland MOs (Sesvete) experienced up to 5 events / 23 heatwave days, while elevated Medvednica MOs (Podsljeme) had zero.
| District | Mean HW days | Mean HW events |
|---|---|---|
| Sesvete | 18.3 | 3.7 |
| Donja Dubrava | 17.4 | 3.5 |
| Peščenica — Žitnjak | 16.8 | 3.4 |
| Novi Zagreb — Istok | 16.2 | 3.2 |
| Podsljeme | 0.0 | 0.0 |
The strongest predictor of heatwave days per MO is the summer mean nighttime minimum temperature (Pearson r =0.91), far stronger than daytime LST (r = 0.36). MOs that cool below 20 °C at night cannot meet the tropical-night criterion on most days.
TALEA-inspired analytical layers
Four additional raster layers on the interactive map are inspired by theTALEA platform (Municipality of Bologna, European Urban Initiative — Innovative Actions). They appear on the dashboard under the TALEA Layers group.
| Layer | What it shows |
|---|---|
| MODIS Nighttime LST | Where nights stay warm (~1 km). Warm nights (>24 °C) signal overnight heat retention. |
| LST Z-Score (Anomaly) | Per-pixel statistical anomaly: blue = cooler than city average, red = hotter. |
| LST Z-Score Classes (1–10) | Classified version at 0.5 σ intervals for quick communication. |
| Urban Heat Exposure Index (UHEI) | Composite 0–3 risk: LST + (1−NDVI) + (1−Albedo). Adds reflectivity as a third dimension. |
Heat × population, markets & cycling
Hot districts (recap)
A district counts as “hot” if its mean heat anomaly is at or above the75th percentile of all 17 districts (+5.7 °C above the green/rural reference): Donji Grad, Trešnjevka – sjever, Trnje, Stenjevec, Novi Zagreb — Istok.
Population × heat
| Dimension | Top neighbourhoods (citywide) | In hot districts |
|---|---|---|
| Elderly (65+) | Hrvatski narodni vladari · Mimara · Cvjetnica · Gupčeva zvijezda · August Cesarec | 3 of 5 |
| Children (0–14) | Veliko Polje · Budenec · Odra · Jakuševec · Novi Jelkovec | 2 of 5 |
| Population density | Matko Laginja · Nadbiskup Antun Bauer · Novi Jelkovec · Gajnice · Špansko — Sjever | 3 of 5 |
Headline: Vulnerable populations and the urban heat island geographically coincide — the strongest equity finding in the study.
Outdoor markets in hot areas
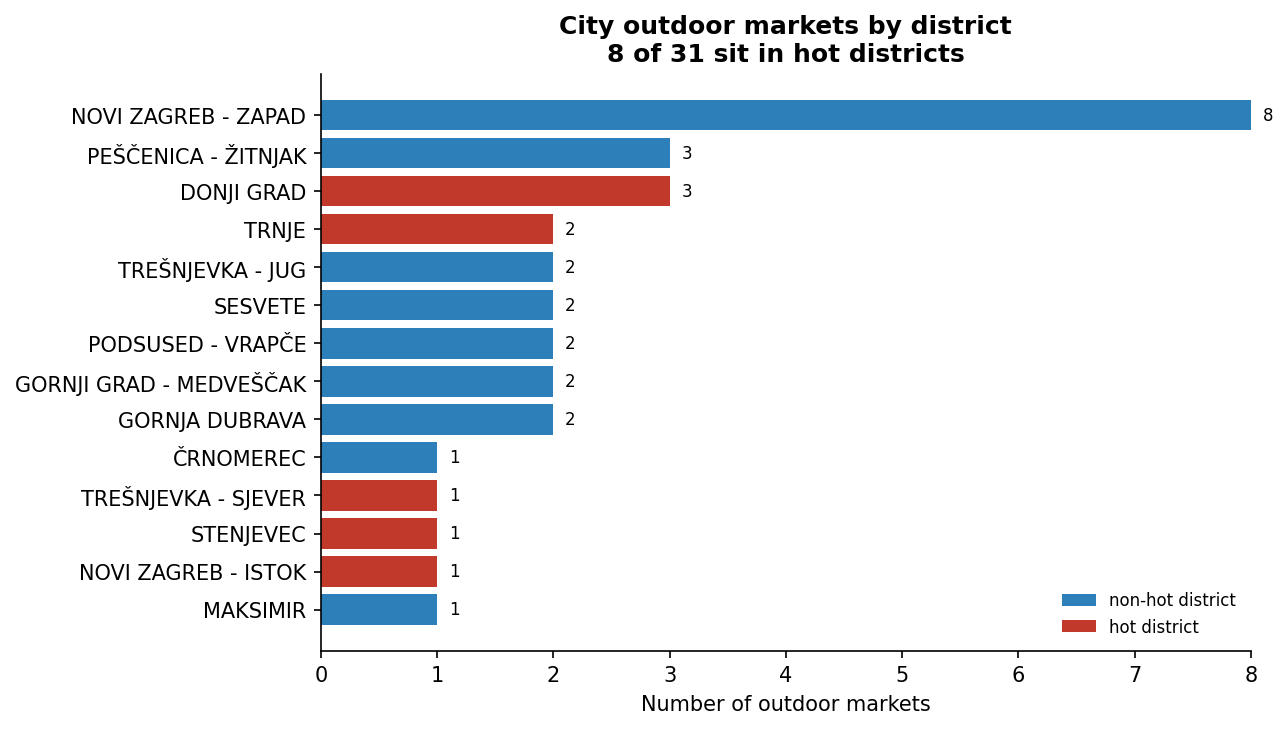
8 of 31 city outdoor markets sit in hot districts, including all three Donji Grad markets: Kvaternikov trg, Branimirova, Zagreb UPRAVA; plus Trešnjevka, Trnje, Savica, Špansko, and Utrina. These are places where people — often elderly — are outdoors in the hottest hours. Shading, drinking water, and cooler surfaces at these markets would have visible public-health benefit.
Cycling infrastructure in hot areas
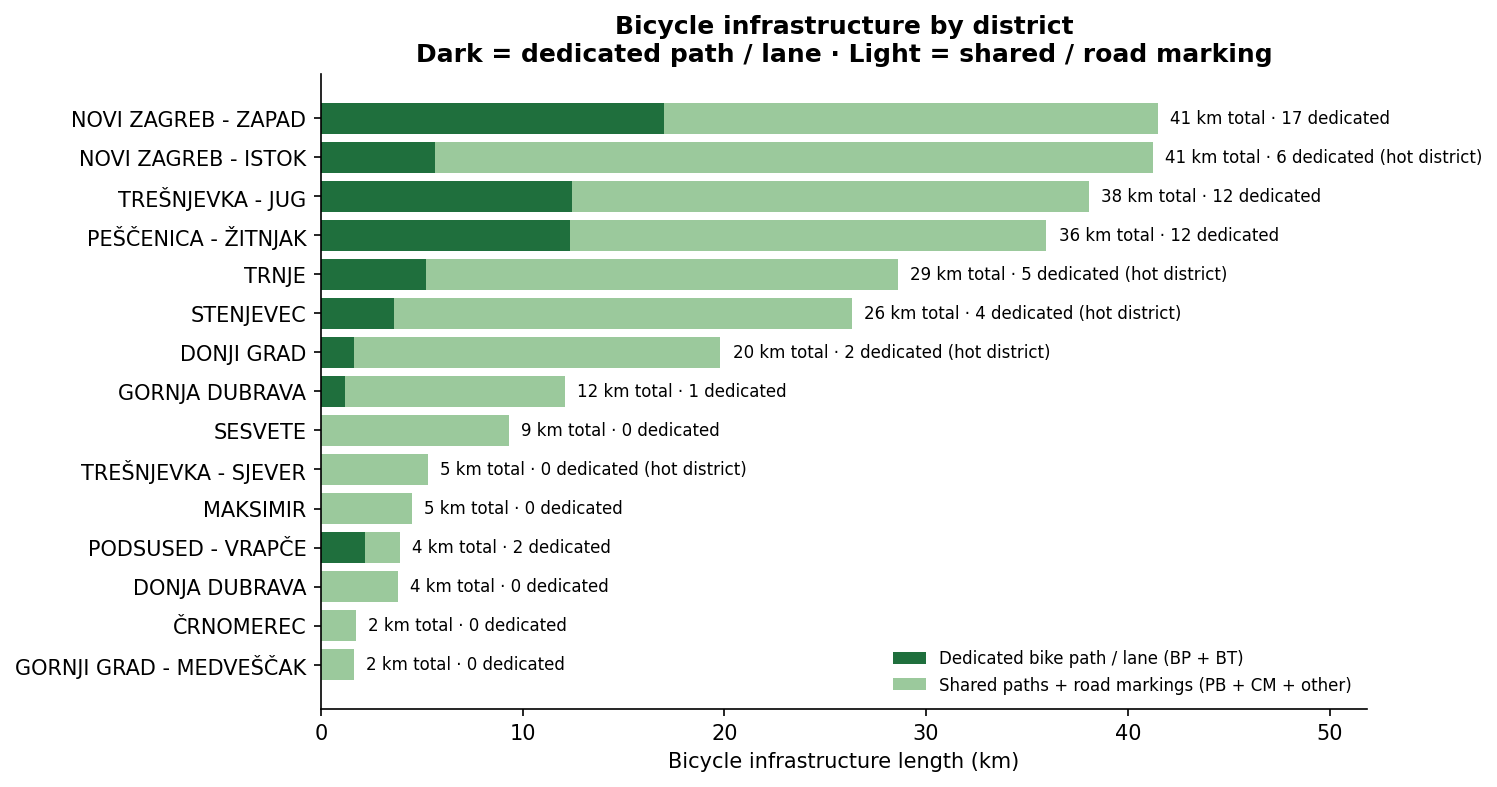
The city reports 274 km of cycling-related network when shared paths and road markings are included; about61 km is strictly dedicated bike path or lane. In hot districts:
- Trešnjevka – sjever (second-hottest district) hasno strictly dedicated cycling infrastructure — only shared paths.
- Donji Grad has only ~1.7 km dedicated of ~20 km total — narrow historic streets limit options.
- The longest dedicated networks are in cooler or mid-heat districts (e.g. Novi Zagreb – zapad, Trešnjevka – jug).
In hot areas, feasible improvements are oftenshade and microclimate along existing shared paths rather than new segregated lanes.
Priority neighbourhoods & interventions
Ten neighbourhoods score on multiple dimensions at once: hot district, high density, and above-average elderly share. They are a defensible starting point for targeted heat action.
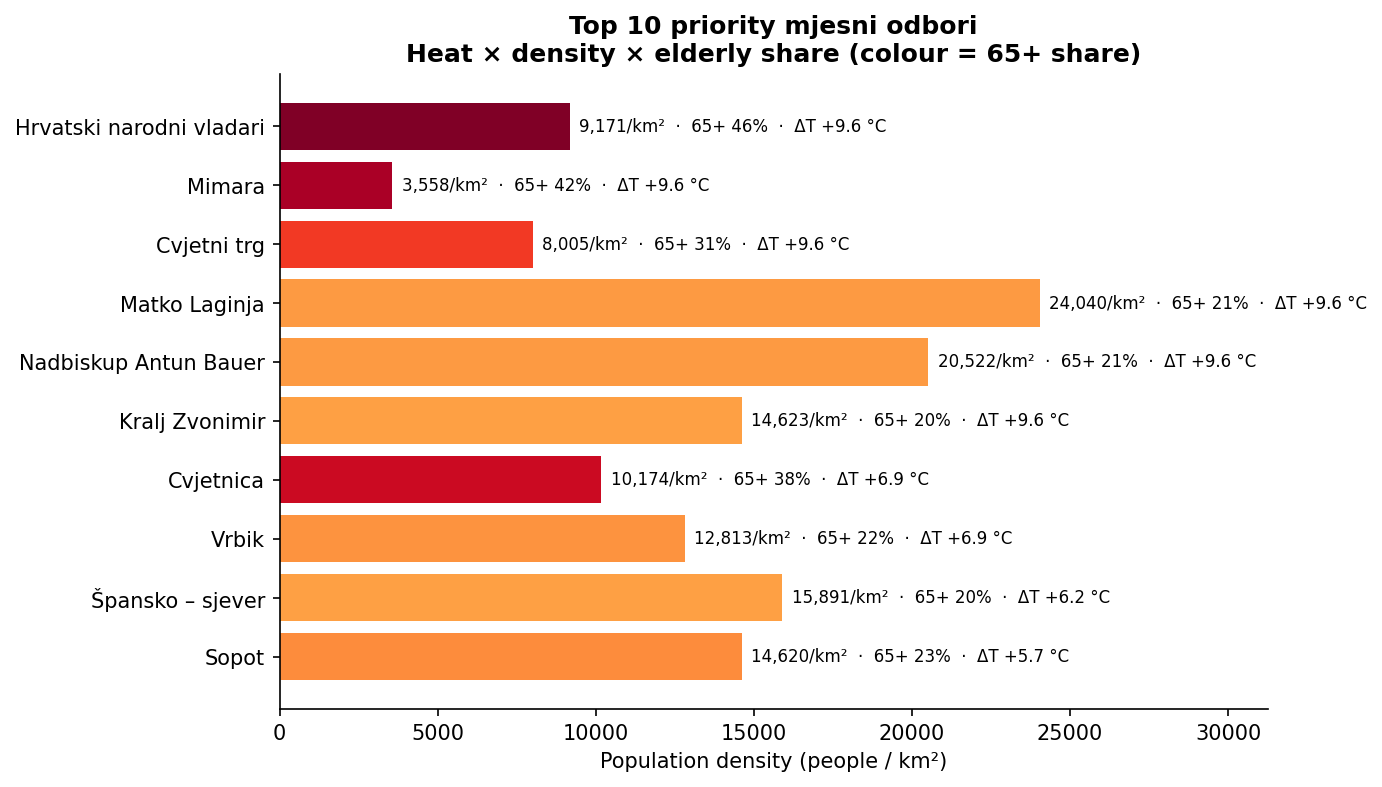
| # | Neighbourhood | District | Density | 65+ | Heat ΔT | Intervention ideas |
|---|---|---|---|---|---|---|
| 1 | Hrvatski narodni vladari | Donji Grad | 9,171/km² | 46% | +9.6 °C | Courtyard trees; cool roofs; shaded seating and drinking water near care routes. |
| 2 | Mimara | Donji Grad | 3,558/km² | 42% | +9.6 °C | Façade greening; trees along Roosevelt and Mihanovićeva; museum forecourt greening. |
| 3 | Cvjetni trg | Donji Grad | 8,005/km² | 31% | +9.6 °C | Light-coloured paving in pedestrian zones; temporary shade on Bogovićeva. |
| 4 | Matko Laginja | Donji Grad | 24,040/km² | avg. | +9.6 °C | Highest priority for inner-block greening and permeable courtyard surfaces. |
| 5 | Nadbiskup Antun Bauer | Donji Grad | 20,522/km² | avg. | +9.6 °C | Link interior courtyards into a cooling network. |
| 6 | Kralj Zvonimir | Donji Grad | 14,623/km² | avg. | +9.6 °C | Trees on Kneza Branimira; shade upgrade at Tržnica Branimirova. |
| 7 | Cvjetnica | Trnje | 10,174/km² | 38% | +6.9 °C | Shaded seating near healthcare; trees along Vukovarska; cool-pavement pilot streets. |
| 8 | Vrbik | Trnje | 12,813/km² | avg. | +6.9 °C | Canopy along Vukovarska/Savska; micro-parks from oversized parking; Sava embankment cool corridor. |
| 9 | Špansko — Sjever | Stenjevec | 15,891/km² | avg. | +6.2 °C | Green roofs on flat blocks; inter-block planting; shade at Tržnica Špansko. |
| 10 | Sopot | Novi Zagreb — Istok | 14,620/km² | avg. | +5.7 °C | Connect inter-block greenery; water feature or spray park; link with estate retrofits. |
Intervention types (by impact)
- Street and courtyard tree planting — often the most cost-effective; mature trees can lower local heat anomaly by 2–5 °C.
- Cool roofs and façades — especially on large post-war estates.
- Shade at outdoor markets — eight named hot-district markets.
- Drinking-water points along bike corridors and at markets.
- Light, permeable surfaces in dense pedestrian zones.
- Green façades and pocket parks where street trees are not possible.
Workshop case studies
| Role | District | Why |
|---|---|---|
| Hot core | Donji Grad | Highest heat anomaly, low greenness, oldest population, three markets |
| Cool reference | Podsljeme | Lowest heat anomaly, highest greenness — model for what more cover delivers |
| Mixed contrast | Novi Zagreb — Zapad | Mid-range heat, large area — test varied interventions |
What this means for the team
- Prioritise neighbourhoods, not only districts. The 32 dense-and-hot areas — 12 in Donji Grad — are the actionable units.
- Tie heat to people. Elderly concentration in Donji Grad and Trnje is the most policy-relevant pattern.
- Use markets and bike corridors as concrete project lists. Shade, water, and trees at named places.
- Invest in vegetation. Cooling Zagreb means adding green, not only limiting building.
- Combine surface heat, air timing, and population. The map shows where; station profiles show when; census shows who.
- Target nighttime heat retention. Heatwave exposure is driven by tropical nights (Tmin ≥20 °C), not daytime peaks. Permeable surfaces, tree canopy, and green roofs in eastern lowland MOs would cut heatwave days disproportionately.
Future research directions
- More night-time satellite coverage for a stable summer night picture.
- Multi-year trend (2015–2025) — implemented: seeRQ-E and NDVI trend.
- Heatwave spatial analysis — implemented: DHMZ-style detection per MO; 3 city-wide events, 10× spatial disparity (seeheatwaves).
- TALEA-inspired analytical layers — implemented: seeTALEA.
- Heat combined with air quality at monitoring stations.
- Schools, kindergartens, and care homes overlaid on hot neighbourhoods —implemented: see RQ-B.
- Tree-cover gap analysis per hot neighbourhood —implemented: see RQ-C anddistrict greenery.
- Walking access to parks and cool public buildings —implemented: see RQ-D.
- A single heat-vulnerability index per neighbourhood —implemented: see RQ-A.
Problem frames workshop board
Twelve ways to frame the urban heat problem — each with a headline number from the analysis. Click cards to shortlist frames for team workshops.
By location
By population
By activity / outdoor exposure
By systems / adaptive capacity
By cause / lever
By time
By priority tool
12 frames across 7 lenses. Every headline number was verified against the analysis tables. Green badge = directly reproduced from data; amber = true but with a stated caveat. Two angles are intentionally absent — where interventions currently exist, and heat × air-quality — because that data has not been computed.
Research questions A–E (planning analysis)
Composite heat-vulnerability index, sensitive facilities, tree-cover deficit, cool-refuge access, and multi-year UHI trends for 32 hot+dense neighbourhoods (May 2026 analysis run).
RQ-A — Composite Heat-Vulnerability Index
Weighted HVI across all 218 mjesni odbori: UHI, elderly share, density, NDVI gap, and heatwave days.
Map layer: Heat vulnerability index (HVI) under Findings.
Method
Composite HVI weights:
- UHI anomaly — 30%
- Elderly share — 25%
- Population density — 20%
- NDVI gap — 15%
- Heatwave days — 10%
Headline numbers
- Max HVI: 0.762 — Nadbiskup Antun Bauer (Donji Grad)
- Citywide mean HVI: 0.417 across 218 MOs
- 32 high-priority hot + dense neighbourhoods
- 12 of those top-priority MOs are in Donji Grad
Top neighbourhoods (illustrative)
- Nadbiskup Antun Bauer — HVI 0.76, ΔT +9.6 °C, elderly 29%, density ~20.5k/km²
- Pavao Šubić — HVI 0.75
- Travno (Novi Zagreb — Istok) — HVI 0.74
- Hrvatski narodni vladari — HVI 0.74, elderly 46%
- Matko Laginja — HVI 0.73, density ~24k/km²
Note
MOs without direct Landsat NDVI sampling use an NDVI gap estimated from UHI anomaly (regression ΔT ≈ 14.7 − 18.7×NDVI, R²=0.77). Ranking is robust; absolute gap values are refined in RQ-C.
Loading…
RQ-B — Sensitive Facilities in Hot Neighbourhoods
Schools, kindergartens, healthcare, sport sites and fountains inside the 32 hot + dense mjesni odbori.
Map layer: Sensitive facilities under Vulnerability (points in hot / high-HVI MOs highlighted).
Method
Facilities from City of Zagreb GeoHub / ArcGIS (pharmacies, kindergartens, elementary and high schools, sport facilities, drinking fountains) assigned to nearest mjesni odbor (≤4 km).
Headline numbers
- 242 facilities inside the 32 hot + dense MOs
- 62 health / pharmacy
- 71 kindergartens
- 32 elementary schools
- 29 high schools
- 30 / 32 of those MOs have zero drinking fountains
Why it matters
Heat risk is not only rooftop temperature — it is also where children, patients, and outdoor users concentrate on hot days. Use the dashboard to overlay facilities on HVI or summer LST.
Loading…
RQ-C — Tree-Cover Deficit and Cooling Potential
NDVI gap versus realistic and ambitious greening targets, with hectares of trees needed in high-HVI neighbourhoods.
Map layer: Tree cover deficit under Greenery.
Method
Compare current NDVI to realistic and ambitious greening targets for high-HVI mjesni odbori. Convert NDVI gap into estimated cooling (°C) and hectares of tree canopy needed.
What the map shows
deficit_pct— realistic NDVI gap × 100- Prioritises neighbourhoods that are both heat-exposed and under-greened
- Complements district-level NDVI trend (RQ-E)
Planning takeaway
Inner-city MOs with high HVI and large NDVI gaps are the first candidates for street trees, pocket parks, and cool-corridor investments — especially where drinking-fountain coverage is also weak (RQ-B / RQ-D).
Loading…
RQ-D — Cool Refuge Accessibility
Walk time from high-HVI neighbourhood centroids to the nearest cool refuge (park, shade, indoor cool space).
Map layer: Cool refuge access under Greenery.
Method
For priority high-HVI neighbourhoods, measure network / crow-fly access to cool refuges and green areas. Points on the map are MO centroids coloured by minutes to the nearest refuge.
How to read categories
- ≤5 min — good access
- 5–10 min — moderate gap
- >10 min — priority for new cool spaces or shaded routes
Planning takeaway
Even well-greened cities fail residents if cool spaces are not walkable during heatwaves. Pair this layer with sensitive facilities (RQ-B) to see where schools and clinics lack nearby refuge.
Loading…
RQ-E — Multi-Year UHI Trend 2015–2025
Sentinel-2 NDVI greening slopes by district, plus multi-year LST context for Donji Grad and comparison districts.
Map layer: NDVI greening trend under Greenery.
Method
Summer (Jun–Aug) mean LST (Landsat) and NDVI (Sentinel-2 from 2017 onward). District slopes show where canopy is improving or declining over time.
What the map shows
District polygons coloured by ndvi_slope (NDVI change per year). Positive slopes = greening; negative = browning / densification pressure.
Planning takeaway
Use together with tree-cover deficit (RQ-C): a district can still be hot today while slowly greening — or already cool but losing canopy. Investment tables for 2017–2025 greenery spend sit in the analysis outputs for follow-up reporting.
Loading…
Loading…
Loading…
Loading…
Limitations
- The main heat metric is land-surface temperature, not air. Air adds three reference stations and a coarse citywide model — not a dense monitoring network.
- Neighbourhood air differences on the map are small; the elderly exposure layer ranks air and combines it with census age structure.
- Not every neighbourhood had a paired land-surface sample in summer 2025; some statistics use subsets.
- Station averages are not the same as peak heatwave hours — use hot-day percentiles for “how hot it felt” messaging.
- Night surface results use only two clear July satellite passes; neighbourhood values average whole areas (parks, water, and buildings together).
- Census is from 2021; satellite and weather from2025.
- Small districts with few sample points are less statistically stable — though the Donji Grad signal is strong enough that conclusions hold.
- Cycling data does not cover every district equally (e.g. gaps for Podsljeme and Brezovica).
Glossary
| Term | Meaning |
|---|---|
| Urban heat island (UHI) | Built-up areas hold more heat than greener or rural surroundings. |
| Land-surface temperature | Temperature of ground, roofs, and pavements from satellite — not the air people breathe. |
| Heat anomaly (ΔT) | How much warmer or cooler a place is than a green/rural reference. Positive = hotter than reference. |
| Vegetation index (NDVI) | Satellite measure of greenness; higher values mean more vegetation. |
| Gradska četvrt | One of Zagreb’s 17 city districts. |
| Mjesni odbor (MO) | One of 218 local neighbourhoods — finest level with census data. |
| GUP | General urban plan, including official green zones used as a cool reference. |
| Elderly heat exposure score | Combines share aged 65+ with ranked modelled daytime air on the map. |
| Heatwave (DHMZ-style) | ≥3 consecutive days with daily max ≥30 °C and daily min ≥20 °C (tropical night). |
| UHEI | Urban Heat Exposure Index: LST + (1−NDVI) + (1−Albedo), range 0–3. Follows the TALEA (Bologna) methodology. |
| LST Z-Score | Statistical anomaly: (pixel LST − city mean) / city std. Blue = cooler than average, red = hotter. |
| ECOSTRESS | NASA instrument on the space station; finer but irregular land-surface temperature. |