
Heat vulnerability index (HVI)
Findings
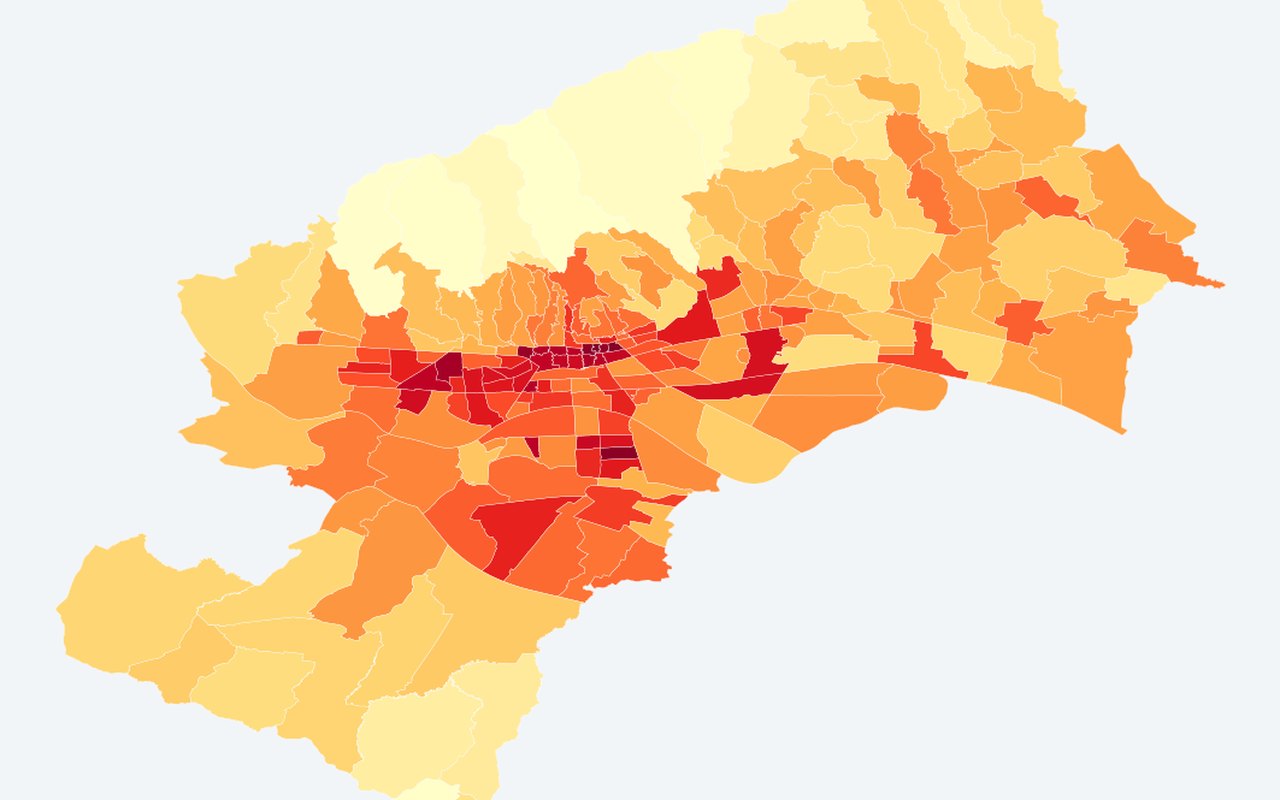
Prioritises neighbourhoods for cooling, outreach, and greening where both hazard and people at risk are high.
What it shows
A single neighbourhood score combining heat, elderly share, density, greenness gaps, and heatwave days. Higher values mark places where heat and sensitive populations overlap.
Data sources
Zagreb neighbourhood heat indicators, Census 2021 age and density, vegetation greenness, and heatwave-day counts.
How it was prepared
Each component is scaled across neighbourhoods and combined into one heat vulnerability index for comparison on the map.
Interpretation limits
An index for screening and discussion — not a medical risk score for individuals.